

Concept · Key levels
Key Levels Backtester — PDH, PDL and Opens
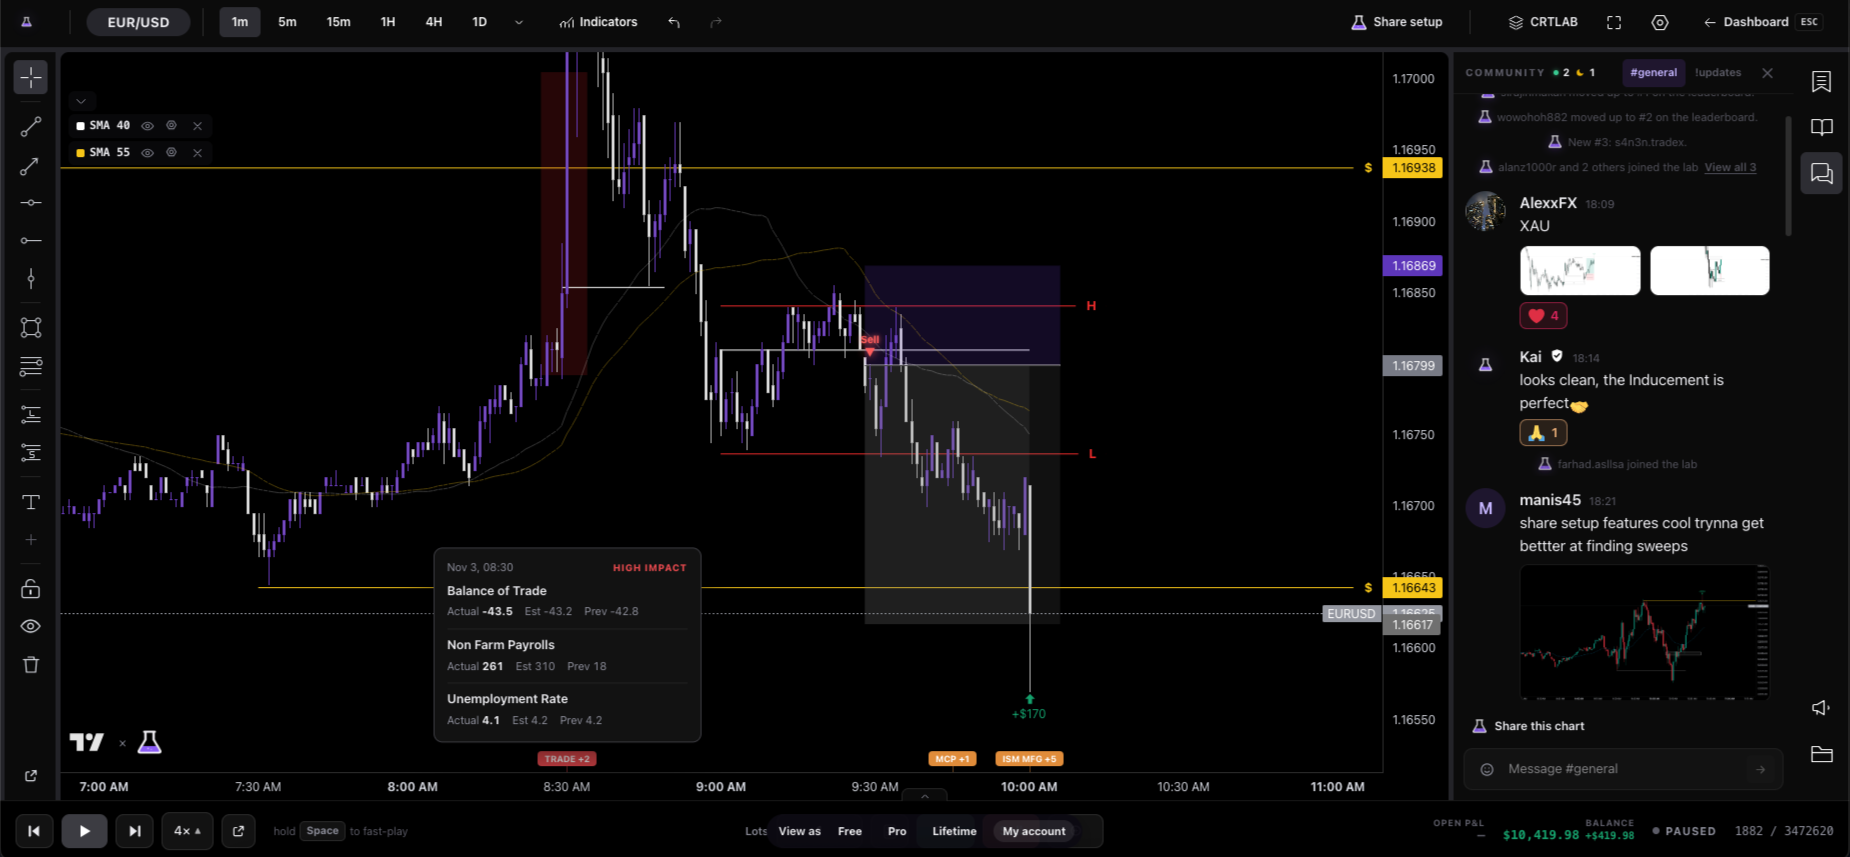
Previous day's high. Previous day's low. The daily open, the weekly open, the session opens. They are the levels the whole market can see, which is exactly why they are worth testing rather than assuming — a level everybody watches either works unusually well or fails unusually hard, and only one of those is tradeable.
Which levels, and why these
Previous day high and low bound yesterday's range, and a market that opens inside it and leaves is telling you something different from one that opens outside and comes back. The daily and weekly opens are reference prices for premium and discount — above the open is expensive, below is cheap, and a surprising amount of intraday method reduces to that one comparison. Premium and discount covers the framing.
Session opens matter for a different reason: they're where a new pool of participants arrives. A level that held all through Asia often means nothing five minutes after London opens, which is a fact your backtest will surface if you log the session and won't if you don't.
What to actually measure
Reaction rate is the obvious one — how often price touches the level and turns. The more useful one is conditional: how often it turns given that it arrived from below, in the New York session, after a sweep. Unconditional reaction rates on obvious levels hover near coin-flip on most instruments, which is why "the PDH works" and "the PDH doesn't work" are both defensible and neither is useful.
Log the misses. A level that price slices through without pausing is the trade that costs you money, and a backtest that only records touches-and-turns is measuring your memory, not the market.
Frequently asked questions
Which levels does it draw?
Previous day's high and low, the daily open, the weekly open and the session opens — drawn automatically for every day of the replay, at the values they held at the time.
Are the levels correct in my timezone?
The levels are anchored to the market's own session clock rather than to your browser's, which is what makes a New York open the New York open regardless of where you're sitting. The session times tool shows the windows in your local time.
Can I run these with other concepts?
Yes — key levels plus liquidity sweeps is the most common pairing, because it shows both the level and the moment it gets taken.
Open US30 with the key levels drawn
One click — PDH, PDL, daily and weekly opens on a 15-minute Dow chart.
Open the chart →