

Concept · Liquidity
Liquidity Sweep Backtester
"They swept the highs and reversed" is the most-repeated sentence in modern trading and one of the least-measured. A sweep is a mechanical event — price takes out a prior high or low and closes back inside — so the reversal rate that follows is a number you can go and get.
What counts as a sweep
Price trades beyond a prior high or low — the resting liquidity — and then closes back on the other side of it. The wick alone is not the event; the close back inside is what separates a sweep from a genuine break. That distinction is the whole thing, and it's why a sweep can only be marked one candle after it happens.
The levels that get swept are the obvious ones, because obvious is the point: prior session high and low, previous day's high and low, equal highs. What is liquidity in trading covers why those particular levels hold stops, and the liquidity sweep reference entry is the strict definition.
Sweeps are a session phenomenon — test them that way
Sweeps are not evenly distributed through the day. The London open takes out Asia's range; the New York open takes out London's. Backtesting sweeps without session context produces a mush of an average that describes no part of the day.
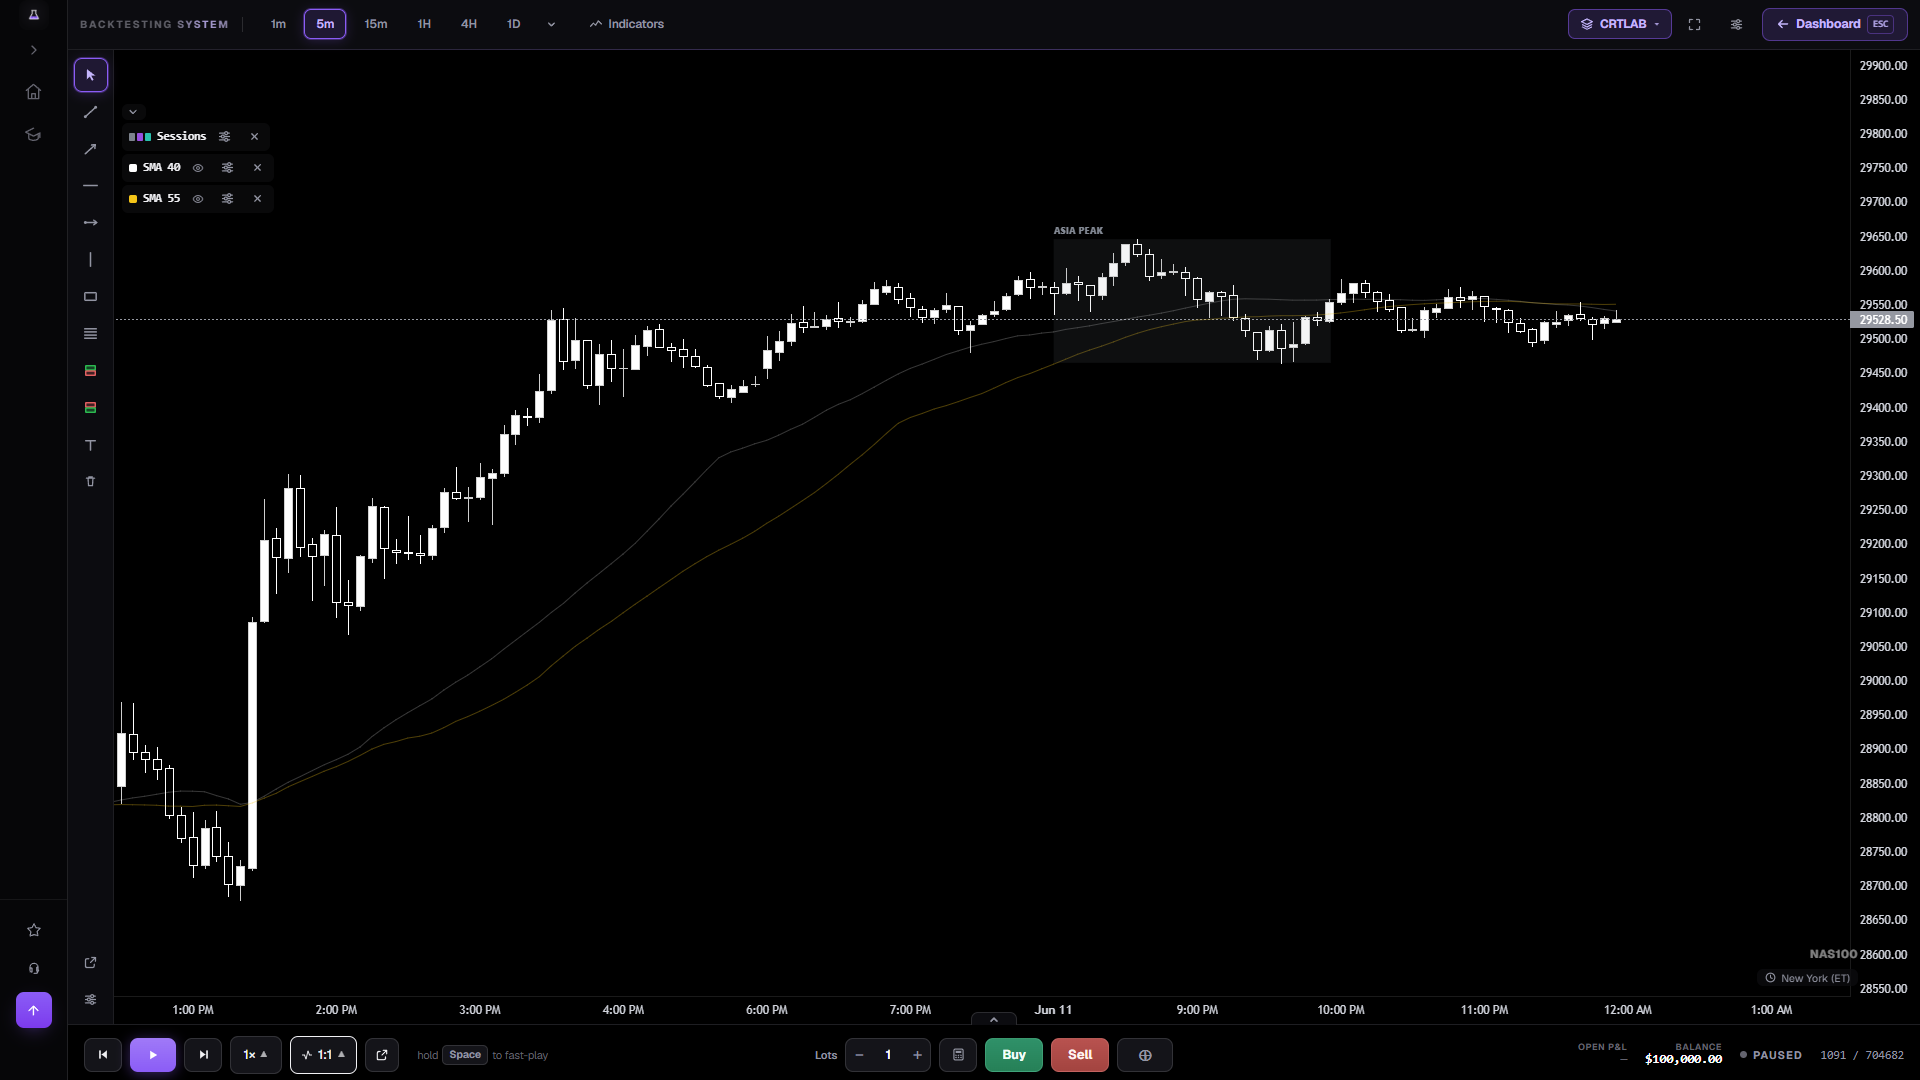
CRTLAB draws session boxes on the same chart, so you can log which session each sweep happened in and split the results afterwards. That split is usually where the edge was hiding. The session times tool has the exact windows in your timezone if you need to fix them first.
Running the test
Switch on the sweep detector together with key levels, so you see the level and the event that took it. Step forward candle by candle and log every sweep that meets your rules — including the ones where price kept going, because a sweep that becomes a genuine break is the failure case that sets your stop.
Then split the log three ways: by session, by which level was swept, and by whether structure shifted afterwards. Three cuts of a few hundred sweeps will tell you more about your market than any course.
Frequently asked questions
How does the tool distinguish a sweep from a breakout?
By the close. Price must trade beyond the level and then close back on the original side of it — a candle that closes beyond the level is a break, not a sweep, and it isn't marked as one.
Can I backtest sweeps of equal highs and lows?
Yes — equal highs and lows are their own detector, and running it alongside the sweep detector shows the pool forming and then being taken.
Is it free?
Yes. Every concept overlay is free on 21 markets for the most recent two weeks of data, without an account.
Which session sweeps most?
That's exactly what to measure rather than take on faith — it varies by instrument. Run the same test on NAS100 and on EURUSD with session boxes on and you'll get two different answers, both useful.
Open NAS100 with sweeps and key levels on
One click — 5-minute chart, prior highs and lows drawn, every sweep marked as it confirms.
Open the chart →