CRTLAB
MarketsToolsFeaturesPricingBlogPartners
DatabentoTradingViewLog inOpen chart
CRTLAB/Features

Everything you needto backtest by hand

Pick a market and a date, hide the future and trade real history one candle at a time, with every tool a discretionary trader uses.

Open the chartSee pricing

See it in action

Real captures of the chart: the future hidden, the overlays drawn as price prints them.
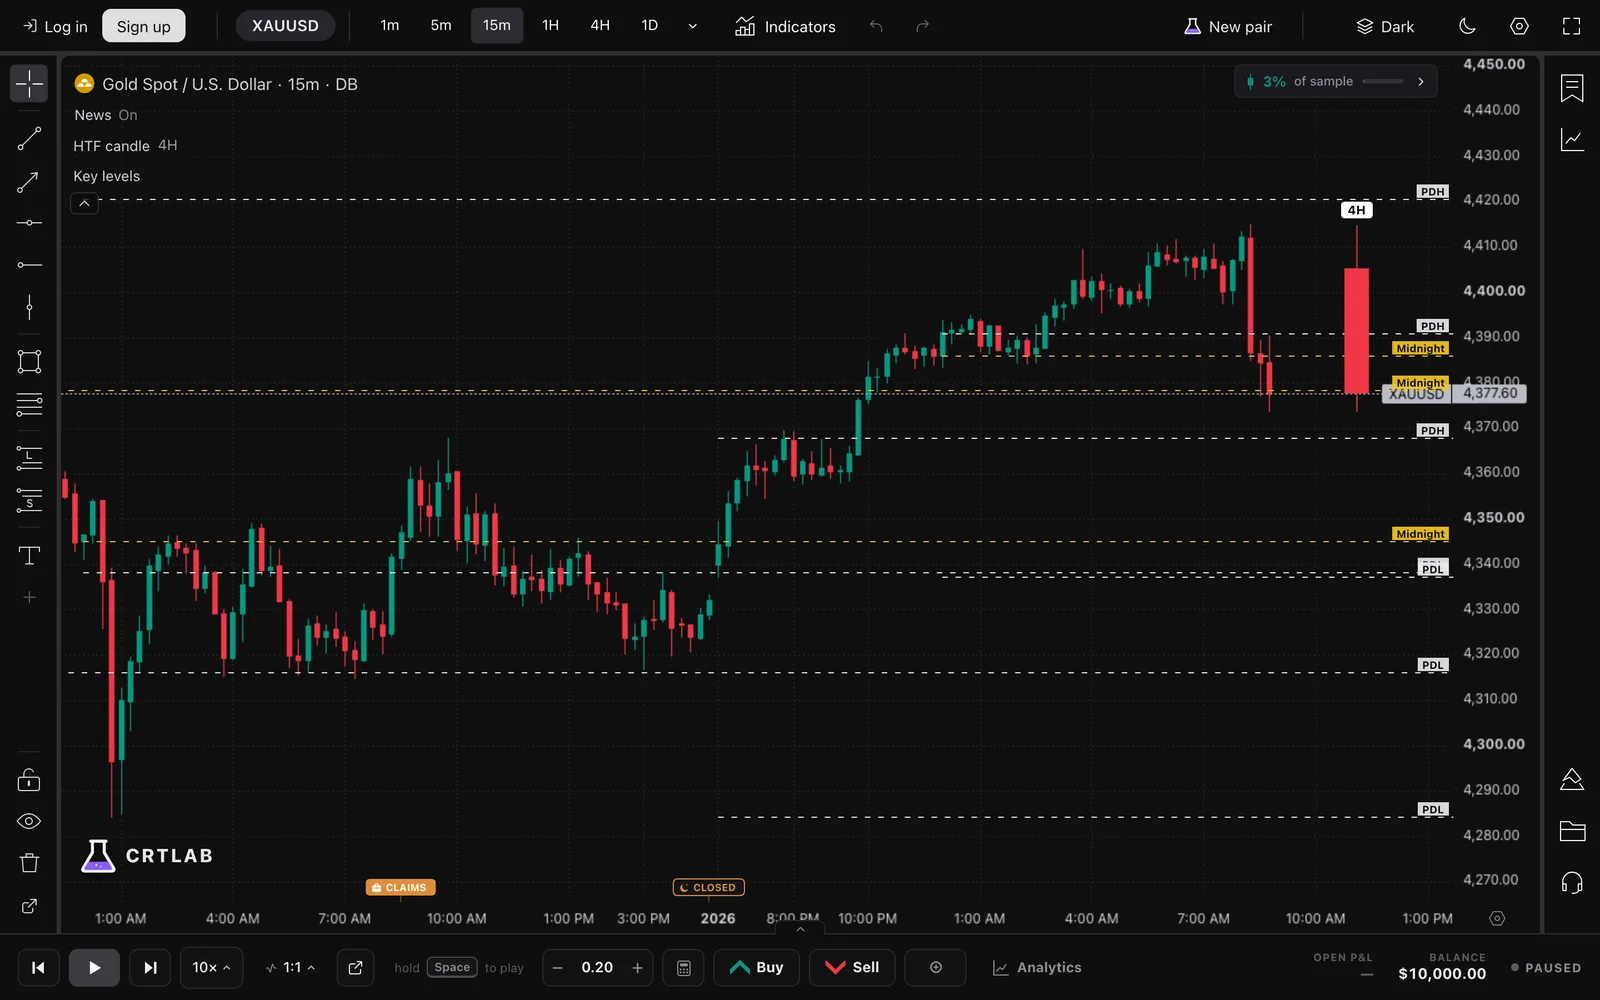
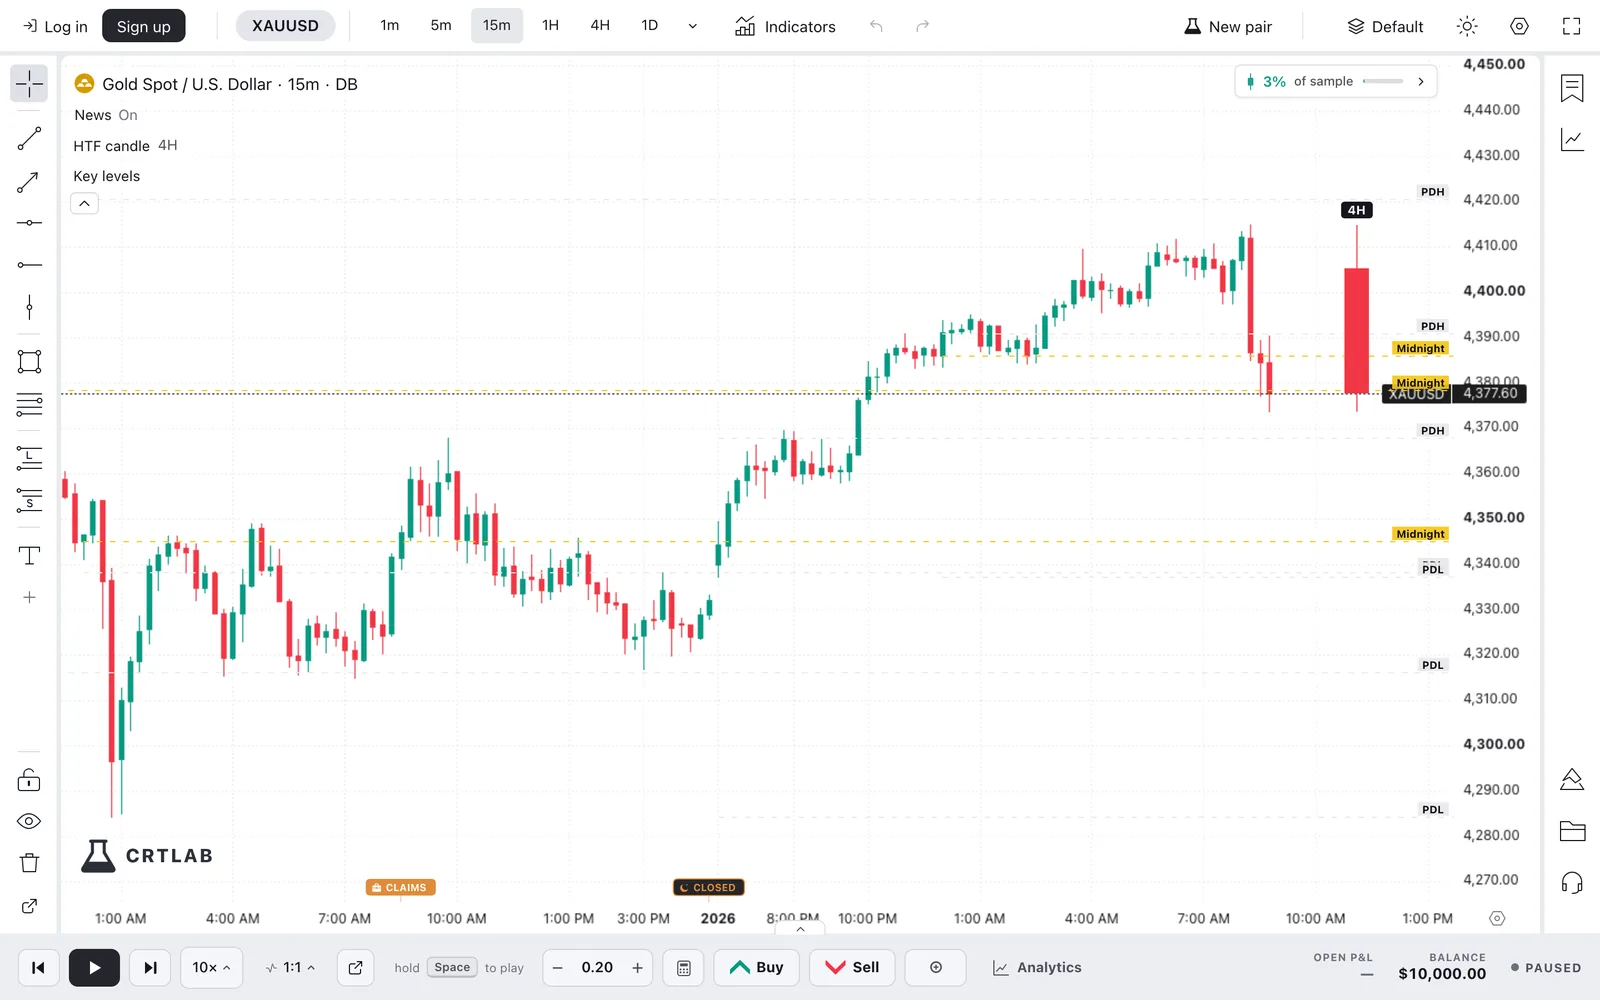
CRTLAB replaying XAU/USD gold on the 15-minute chart with key levels markedCRTLAB replaying XAU/USD gold on the 15-minute chart with key levels marked
XAU/USD, 15-minute, key levels, replayed candle by candle
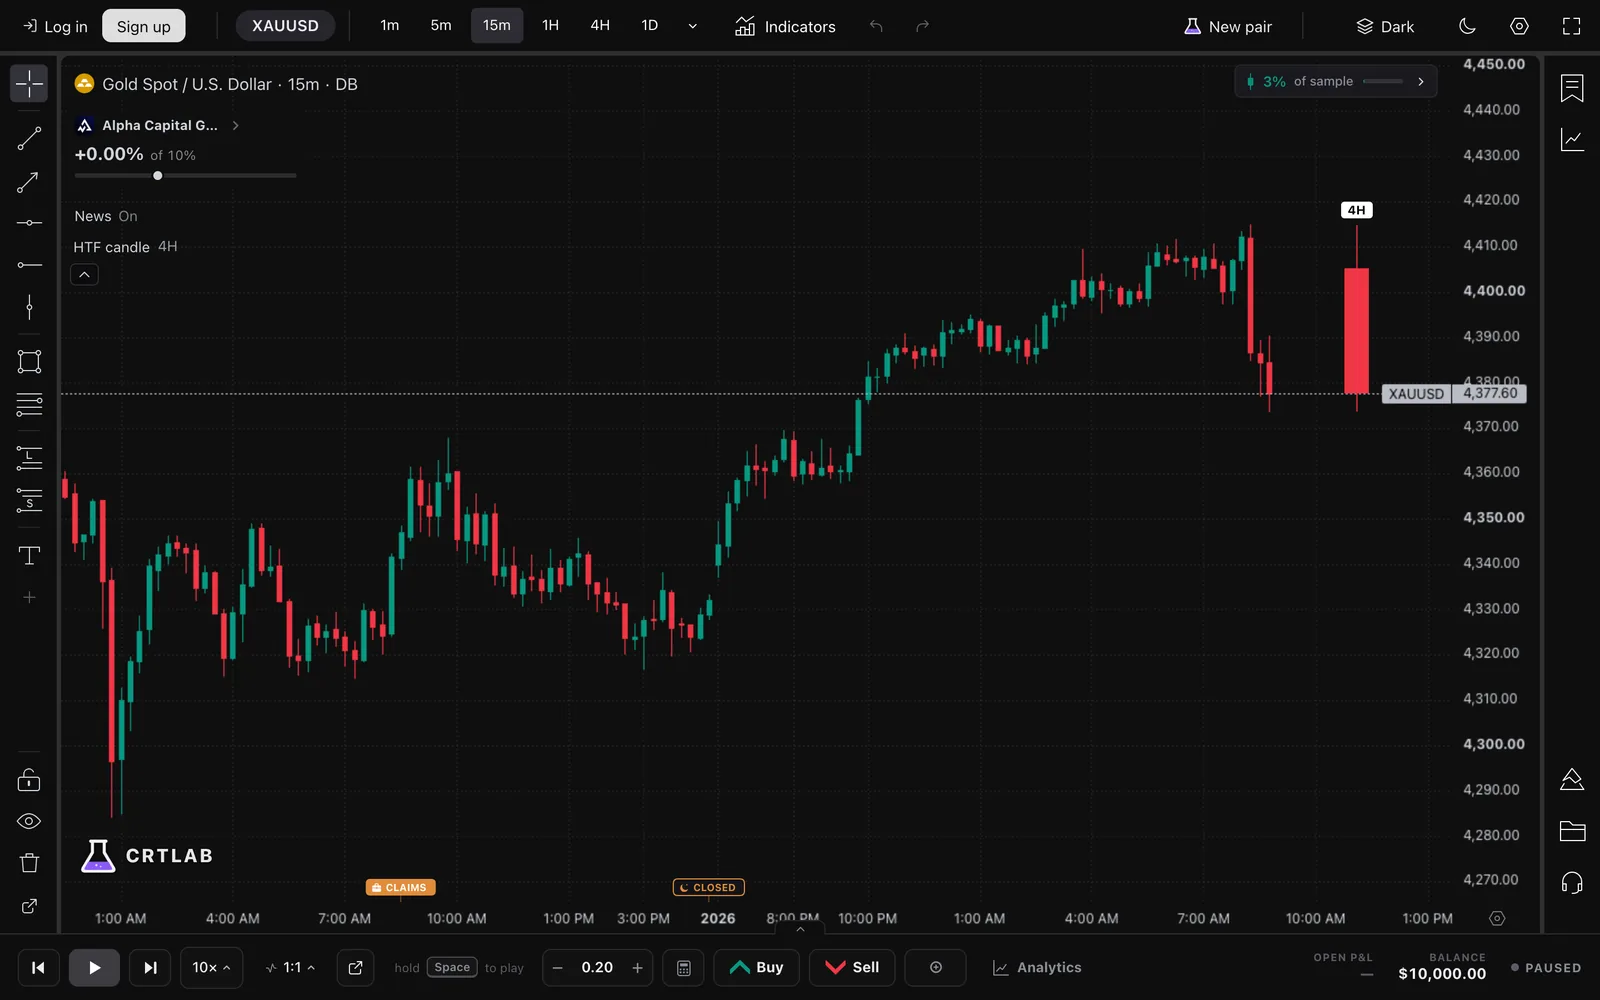
CRTLAB prop firm mode on XAU/USD: the challenge's daily loss and drawdown limits tracked while you replayCRTLAB prop firm mode on XAU/USD: the challenge's daily loss and drawdown limits tracked while you replay
Prop firm mode, the challenge's limits tracked as you replay
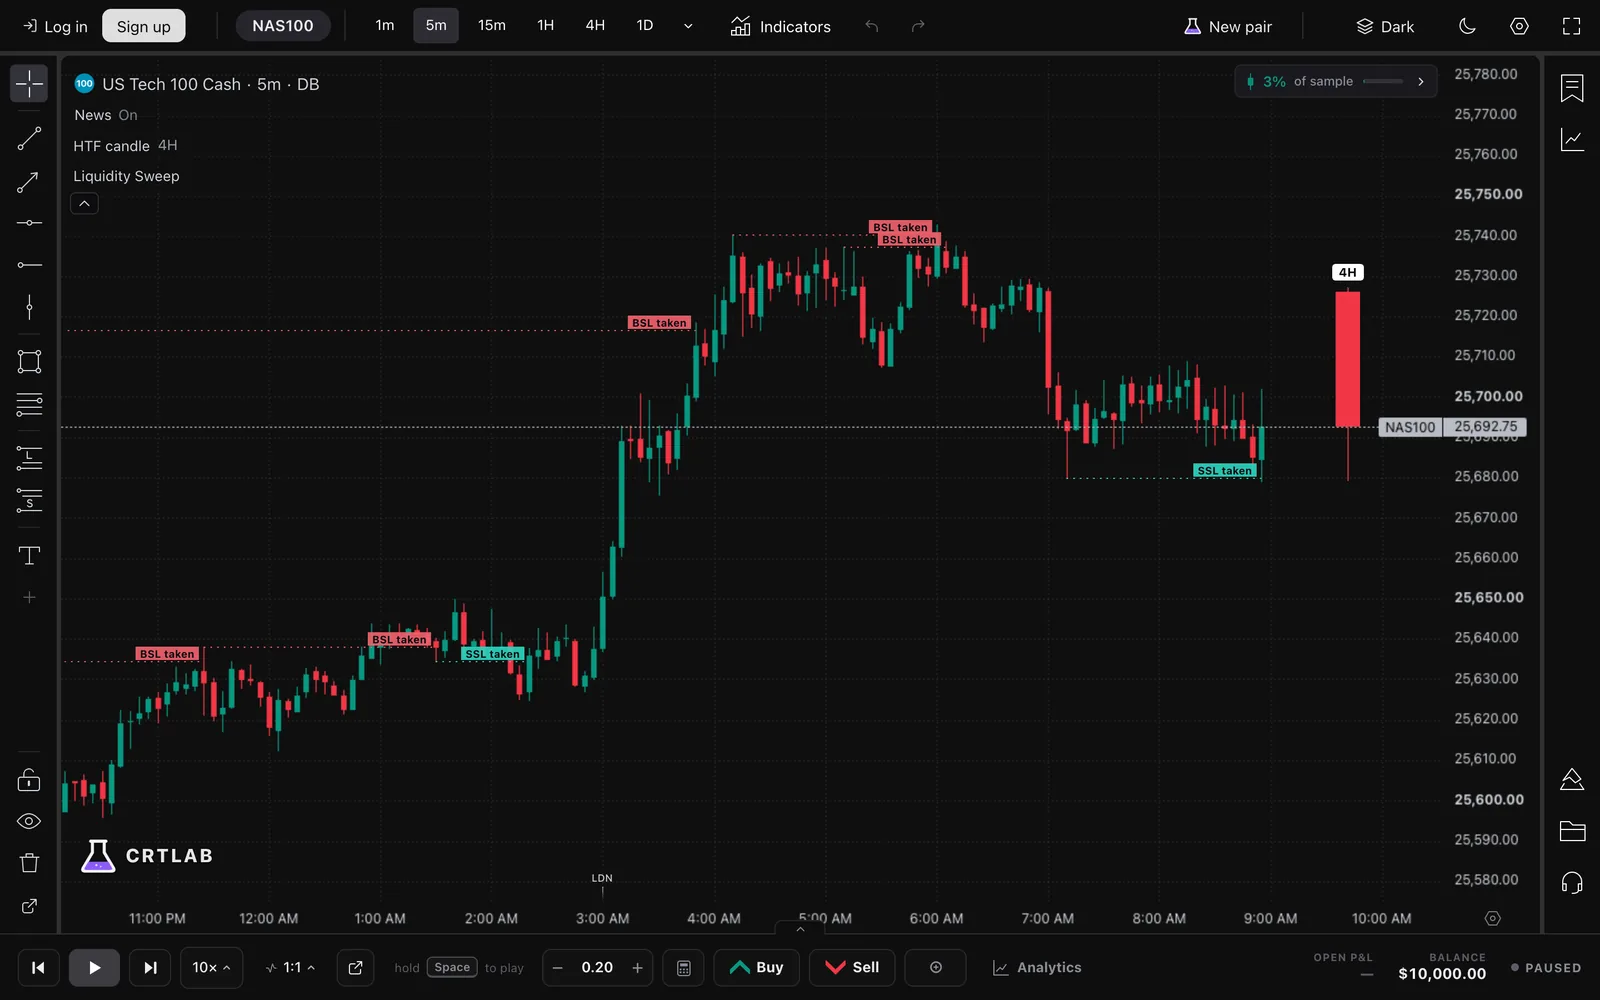
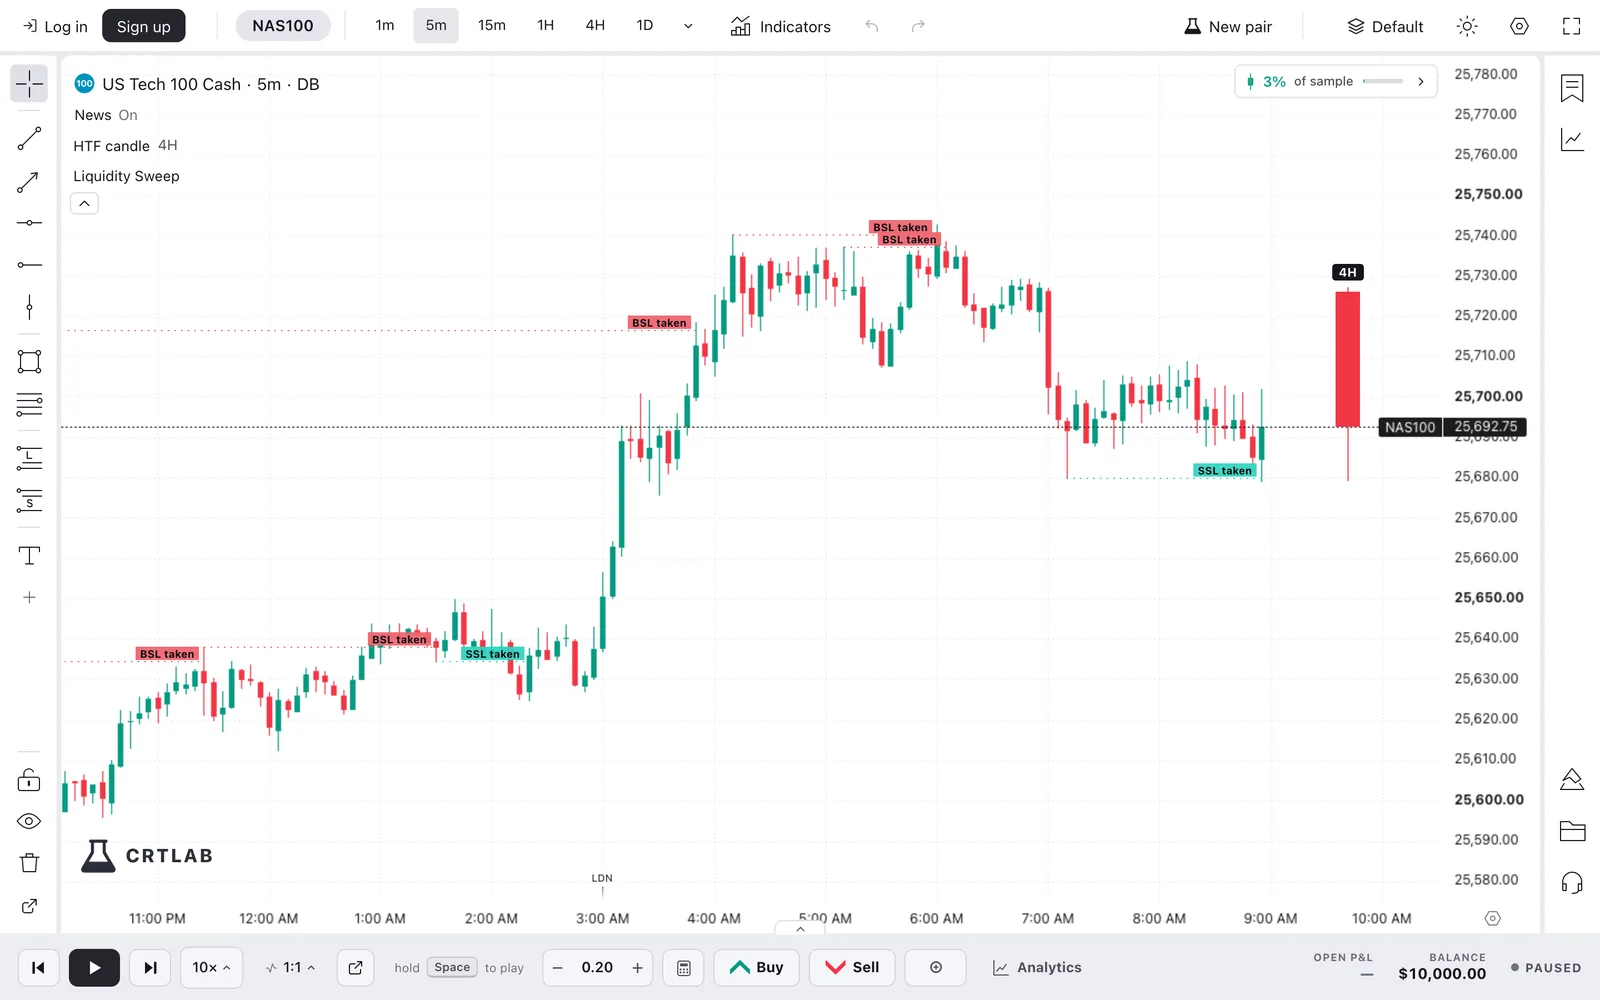
CRTLAB replaying NAS100 on the 5-minute chart with liquidity sweeps marked as they confirmCRTLAB replaying NAS100 on the 5-minute chart with liquidity sweeps marked as they confirm
NAS100, 5-minute, liquidity sweeps marked as they confirm
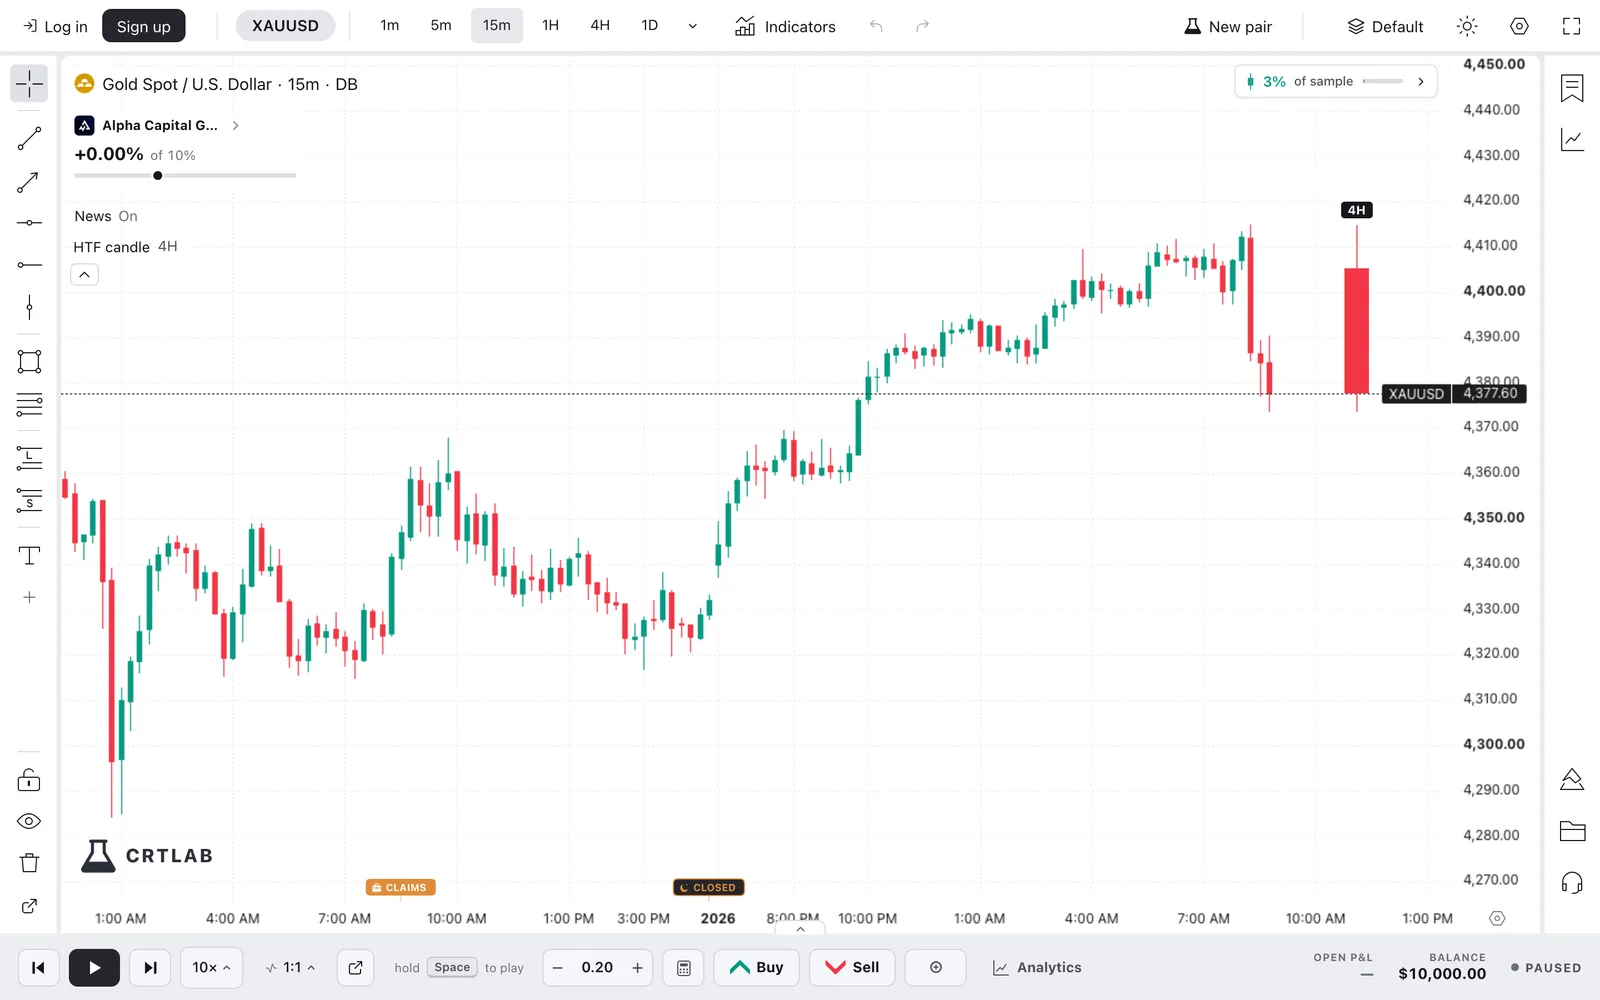
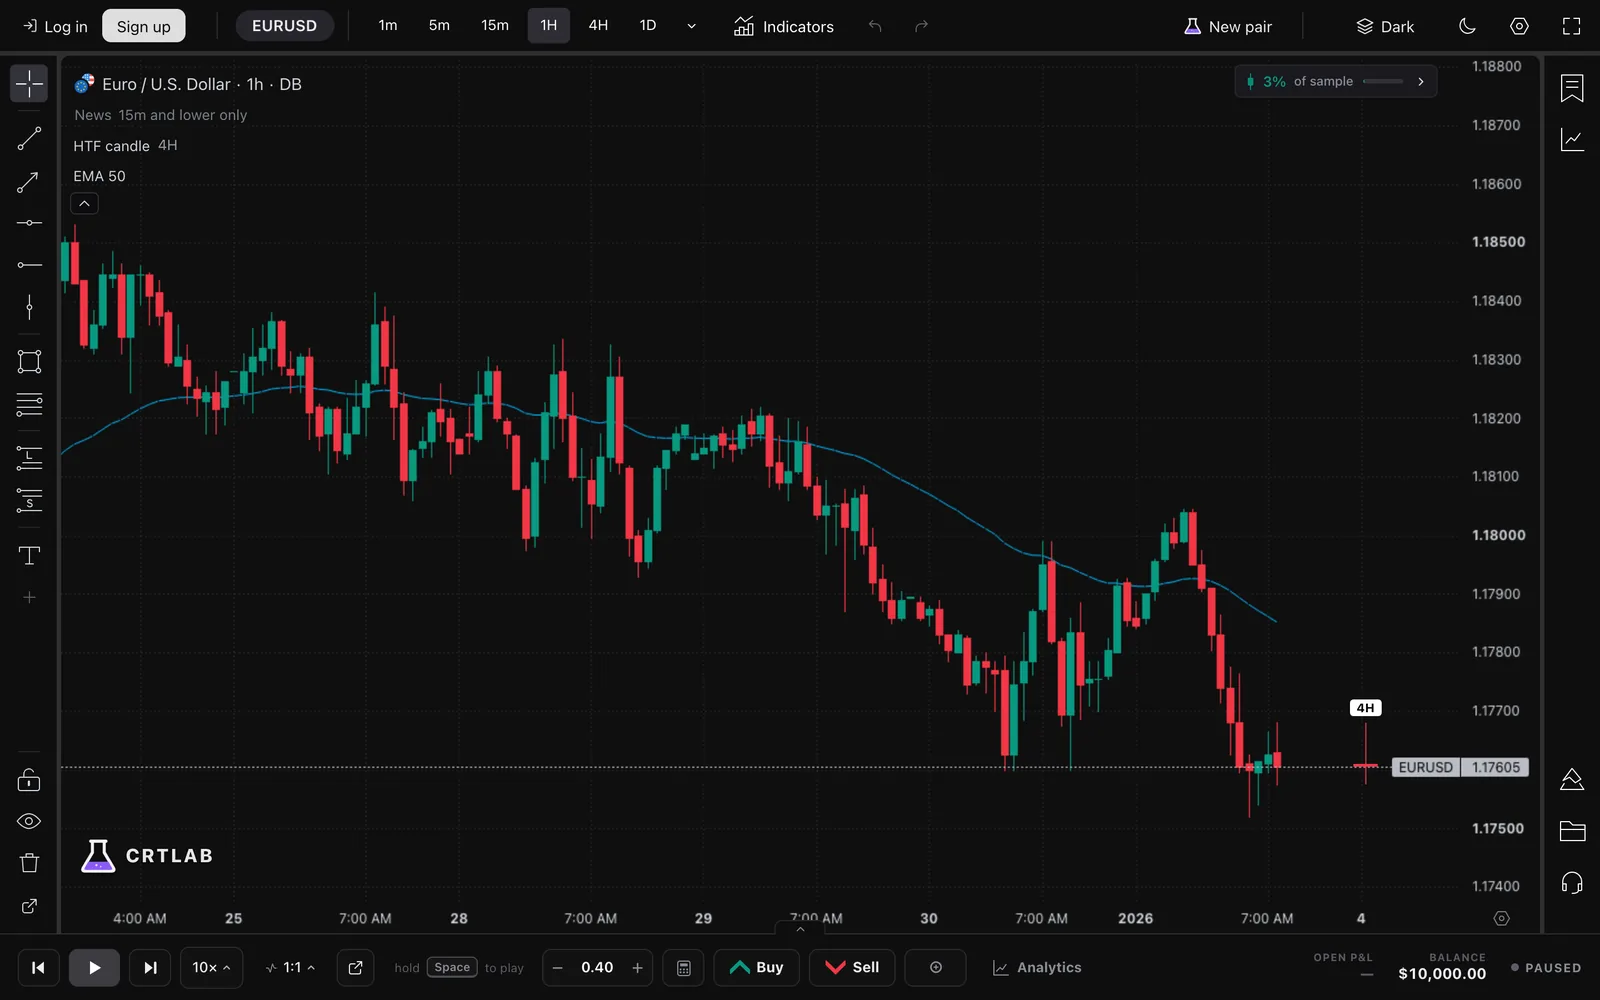
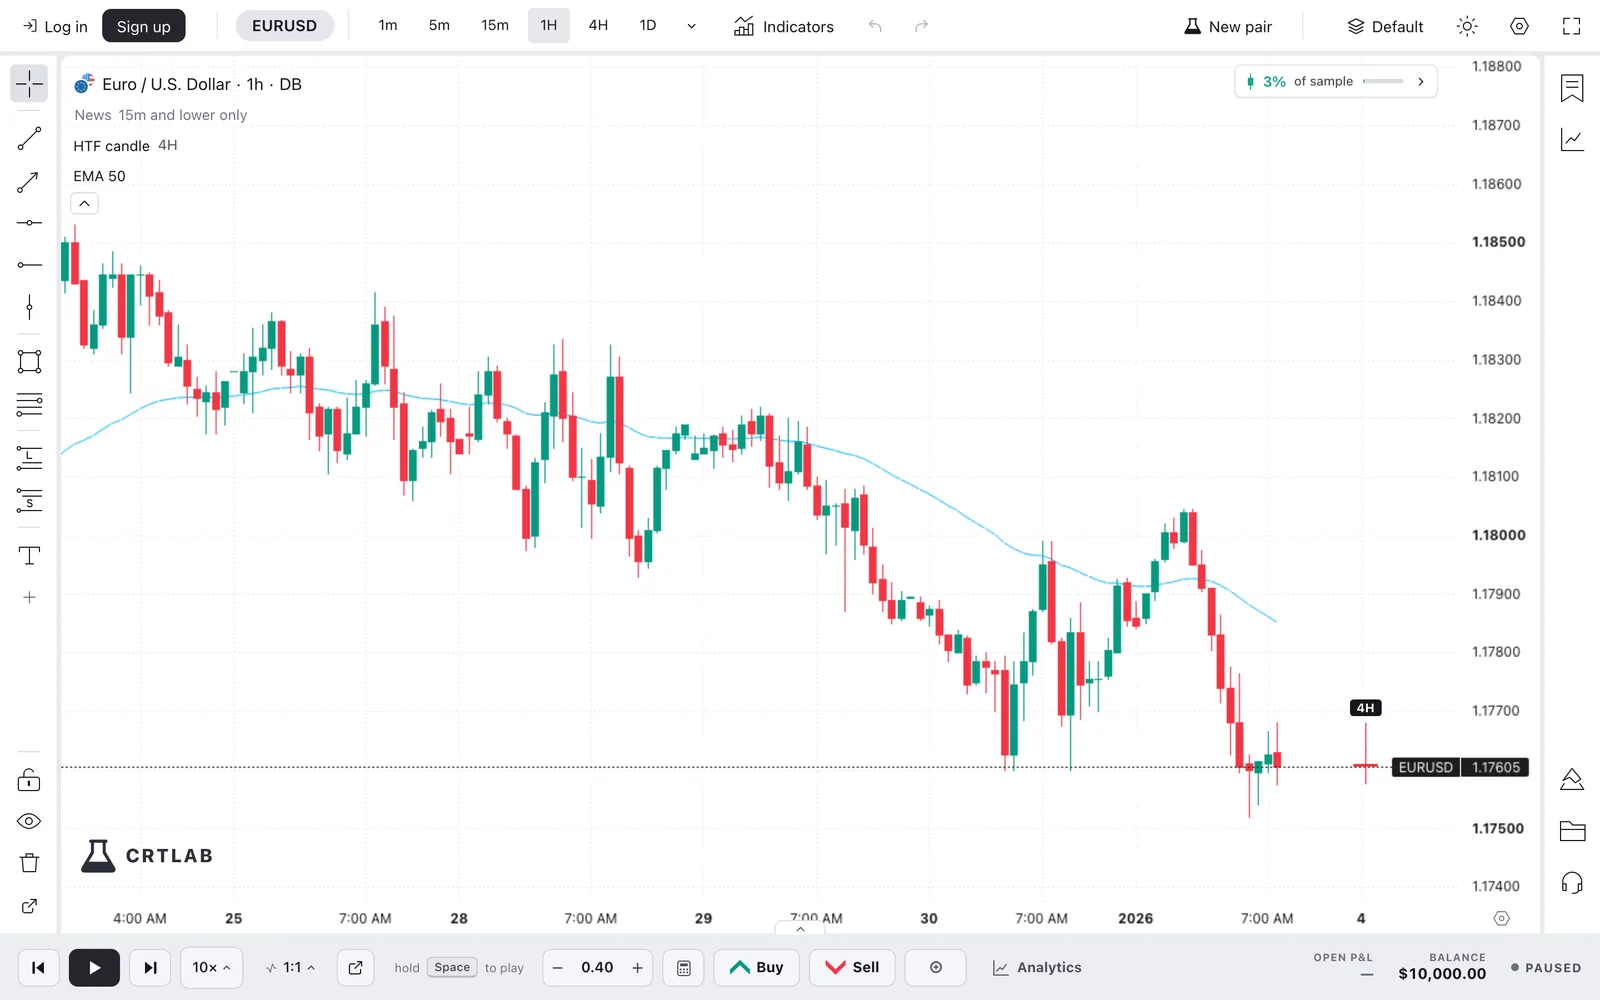
CRTLAB replaying EUR/USD on the 1-hour chart with a 50 EMACRTLAB replaying EUR/USD on the 1-hour chart with a 50 EMA
EUR/USD, 1-hour, 50 EMA, replayed candle by candle

Built around the replay

The right-hand side of the chart is genuinely hidden. You read, you decide, you step forward.

Core

Candle-by-candle replay

Rewind any market to any date and step forward one candle at a time, or press play and let it run. You only ever see what a trader saw on that day.

38 markets

Forex, index futures, gold, oil, crypto and US stocks, on the full history.

Trade it like it is live

Place the entry, stop and target on the chart. Lot size follows your risk.

Journal and report

Every trade is recorded, with an equity curve and the numbers that tell you if a setup holds up.

Prop firm mode

Practise a challenge under its drawdown and target rules before you pay for the real one.

FTMOTOPSTEPTHE5ERS

Drawing tools and indicators

Lines, rays, boxes, Fibonacci, long and short positions, and the indicators you already use, on every timeframe from one minute to one month.

Plan, leaderboard and support

Your plan and usage, the leaderboard and support chat in one window, opened from the logo on your chart.

Open the chart

And everything around it

The small things that make a few hundred trades in an evening feel easy.

ICT overlays

Kill zones, session ranges and higher-timeframe candles drawn on the chart as you replay.

News on the chart

Economic events are tagged on the candles they moved, so you test with the news, not around it.

Your own indicators

Script an indicator, run it safely in your browser and replay it candle by candle like a built-in.

Every device

Sign in and your sessions, drawings and journal follow you to any browser.

Desktop app

Prefer a dedicated window? The same product runs as a desktop app.

Support chat

Message us from inside the app and get the reply in the same chat.

Free trading tools

Position size, risk to reward, pip value, drawdown and more, free without an account.

Guides and reference

Plain definitions of CRT and ICT concepts, and how to backtest them properly.

Open a chart and press play

No card and no download. 10,000 candles of replay as a free sample.

Open the chartFree tools
10,000 candles freeNo card to startData & charts DatabentoTradingView
CRTLAB

Replay real market history candle by candle, trade it as it forms, and find out what your strategy is actually worth.

Version
v1.11.0
Last updated
3 Nov 2026
Email us
crtlab@proton.me
Based in
United Kingdom

Product

  • Features
  • Pricing
  • FAQ
  • Prop firm simulator
  • Measured answers
  • Market recaps
  • Blog
  • Backtesting software
More
  • Market replay
  • Reference
  • Candle-by-candle replay
  • Prop firm practice
  • Two synced charts
  • Real volume

Free tools

  • Futures tick value calculator
  • Best time to trade
  • Position size calculator
  • Risk/reward calculator
  • Margin & leverage calculator
  • Pip calculator
  • Compounding calculator
  • Prop firm challenge calculator
More
  • Backtest sample size calculator
  • Profit factor calculator
  • Risk of ruin calculator
  • Fibonacci calculator
  • Pivot point calculator
  • Drawdown recovery calculator
  • Average daily range
  • CRT statistics
  • Asian range statistics
  • PDH / PDL statistics
  • FVG statistics
  • Volume profile statistics
  • Order block statistics
  • Session & kill zone times

Backtest

  • NAS100
  • US30 (Dow)
  • Gold (XAUUSD)
  • Bitcoin (BTCUSD)
  • DAX (GER40)
  • WTI crude
  • Forex
  • All markets & concepts

Strategy

  • CRT backtester
  • Footprint chart
  • SMT divergence
  • Volume profile
  • ICT backtesting
  • SMC backtesting
  • FVG backtester
  • Order block backtester
More
  • Liquidity sweep backtester
  • Market structure backtester
  • Order flow

Company

  • Log in
  • Terms
  • Privacy
  • Refunds
  • Risk disclaimer
  • Partnerships
  • Site map
Market data provided byDatabentoTradingViewDatabento for futures, forex and stocks · charts by TradingView
CRTLAB
© 2026 CRTLAB. All rights reserved.Not financial advice. Past results do not guarantee future results.