


Why backtest gold?
Gold's volatility is exactly why so many traders lose on it — a clean-looking setup gets shredded by a news spike, and a good week evaporates in one session. Backtesting XAUUSD shows you your real drawdown and win rate through that volatility, so you're not discovering it live.
It also has a personality worth learning: gold trends hard in the right macro backdrop and chops viciously in the wrong one. Replaying it teaches you which regime your edge belongs in.
What makes gold different to backtest
XAUUSD is a safe-haven asset — it tends to move inversely to real yields and the US dollar, and it catches a bid when risk sentiment sours. It's highly sensitive to CPI, Fed policy and geopolitics, produces large intraday dollar ranges, and respects big round numbers like magnets.
One standard lot of gold is 100 ounces, so a $1 move is worth $100 per lot — sizing errors are expensive here. Use the position size calculator to size gold trades correctly, and when you replay it, watch how it reacts at psychological levels and around scheduled news.
Gold is also where the word pip stops meaning one thing. Brokers disagree on whether one gold pip is a 0.01 move ($1 per lot) or a 0.10 move ($10 per lot) — a factor of ten, and a common cause of positions ten times bigger than intended. The pip calculator settles it from the contract instead of the label. And because 100 ounces at $2,400 is $240,000 of notional, gold eats margin faster than any forex major: the margin calculator shows what a broker locks and how far price can run before a stop-out.
Gold's day, hour by hour (measured)
We measured every New York trading day in our gold archive from 20 September 2024 to 18 September 2026: 514 days, hourly bars, the day running 18:00 to 17:00 New York. The average day covered $83.60 from high to low. This is how that range was spread across the clock, and where the day's high and low actually printed.
Two things stand out. First, the New York morning is the market: 8:00 to 12:00 moves roughly 60% more per hour than London, and it holds about a quarter of all daily highs and lows. The single busiest hour is 9:00 to 10:00, at about $25. Second, a lot of days set one extreme in the first hours after the 18:00 open and never go back. That is where 41% of daily lows printed, which is why an Asian range is worth marking even if you never trade Asia.
The same measurement for the Nasdaq, the Dow, EUR/USD, silver, oil, Bitcoin and seven more markets, with every hour converted to your own time zone, is in the free best time to trade tool. How far a gold day usually travels, and how often it reaches its own average range, is on the average daily range tool.
| New York time | Avg range per hour | Share of daily highs | Share of daily lows | Test it with |
|---|---|---|---|---|
| 18:00–00:00 (Asia open) | $15.80 | 31.7% | 41.1% | Asian range, then the sweep of it |
| 00:00–03:00 (late Asia) | $13.90 | 5.8% | 7.1% | Thin: few daily highs or lows print here |
| 03:00–08:00 (London) | $14.00 | 10.6% | 9.4% | London session, 3 AM Silver Bullet |
| 08:00–12:00 (New York AM) | $22.90 | 27.3% | 26.0% | 8:30 data, FVGs, Power of 3 |
| 12:00–17:00 (New York PM) | $13.10 | 24.1% | 16.5% | Key levels into the close |
Gold and yesterday's high and low (measured)
The previous day's high and low are the first two lines most gold traders draw. We measured what gold did with them on every weekday from 1 July 2022 to 18 September 2026: 1,088 trading days, each running 18:00 to 17:00 New York, the day the chart's daily candle uses. On the 96% of days that opened inside yesterday's range, gold traded beyond PDH or PDL by 17:00 on 85%, and beyond both on only 11%. Yesterday's range was typically about $101 over the last year.
The open picks the side. From the upper half of yesterday's range, gold took PDH on 72% of days and PDL on 26%; from the lower half it was PDL 65%, PDH 28%. The nearer level went first about four times in five, and on 47% of days it went before London had opened, in the Asian evening. Once one side was taken, gold went on to take the other on just 12% of days, and closed past the side it had taken on 52%. A sweep of yesterday's high is not, by itself, a reason to aim at yesterday's low.
The textbook trade at those levels, fading the sweep on the first 15-minute close back inside, won 8.2% of 733 gold trades at a median 7.9 : 1: −0.03R a trade before costs, which is no edge. Mondays are the quiet exception, with a side taken on 75% of them against 87% of other days. Every market, every split and the full trade test are on the free previous day high and low statistics tool.
| Gold days that… | Took PDH | Took PDL | Took both | Nearer side went first |
|---|---|---|---|---|
| opened in the upper half of yesterday's range | 72% | 26% | 10% | 80% |
| opened in the lower half | 28% | 65% | 12% | 77% |
| followed an up day | 69% | 29% | 10% | 81% |
| followed a down day | 32% | 61% | 12% | 77% |
| were Mondays (yesterday = Friday) | 38% | 43% | 6% | 85% |
| were Tuesday to Friday | 54% | 45% | 12% | 78% |
Gold setups worth testing, each one click away
Every link below opens a gold chart with the structure already marked, detected candle by candle and never from a bar you have not reached yet.
The Asian range sweep at London. Mark the overnight range, wait for London to run one side, trade the return. Open gold 5m with sweeps marked.
The New York morning gap. The 8:30 release and the 9:30 equity open leave fair value gaps that gold often comes back to fill. Open gold 1m with fair value gaps marked.
Power of 3 on the daily candle. On 93% of gold's up days over the last five years, the low was in before 10:00 New York. The Power of 3 page has the full numbers and what they do and do not prove.
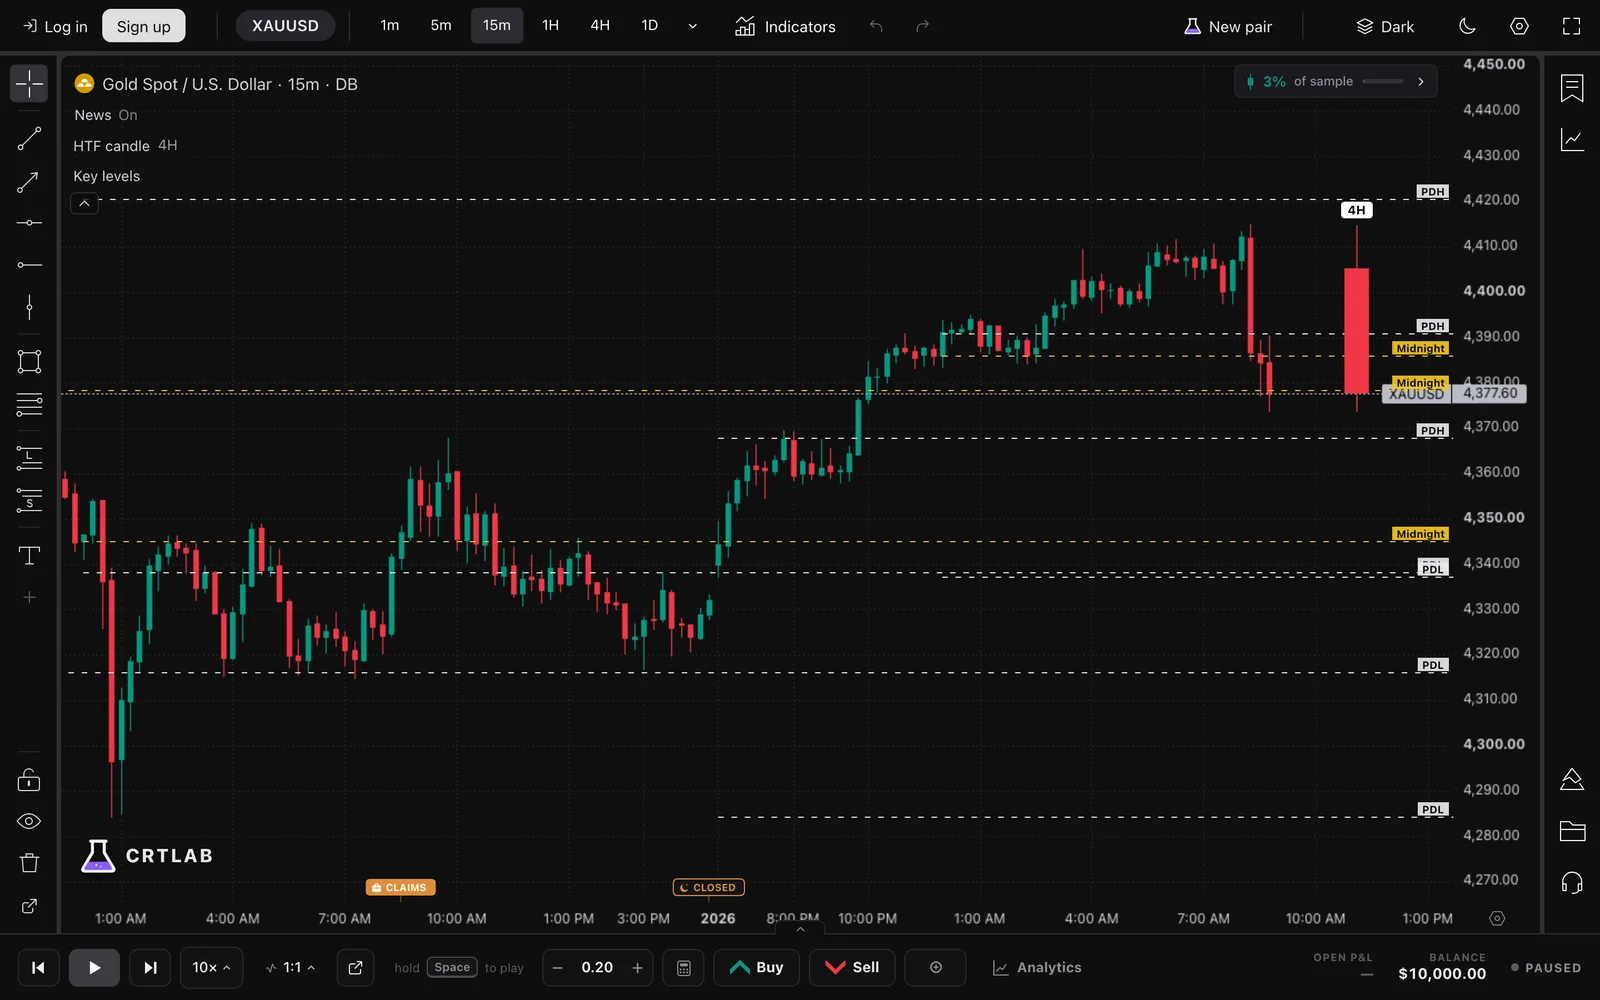
Yesterday's high and low. Gold takes the nearer one on about four days in five, and rarely both. Open gold 15m with PDH and PDL marked and log what happens after the take.
Order blocks on the 15-minute. Open gold 15m with order blocks marked, the classic swing-trader setup on metals.
The part most gold backtests skip: the news candle
Ask a gold trader where their worst losses came from and you will hear the same answer: a release. CPI, NFP, an FOMC statement. And ask how they backtest, and most will tell you they skip those days — which means the strategy has never been tested against the thing most likely to break it.
Skipping news in a backtest does not remove the risk, it removes the evidence. Your win rate goes up, your drawdown looks tame, and the first live CPI print takes a month of gains back. A backtest that flatters you is worse than no backtest, because you size up on it.
The honest version is uncomfortable and quick: replay the release candle by candle. Watch where your stop actually sat when the spike came through. Most people discover their setup was fine and their stop placement was the problem — a distinction you cannot make from a monthly P&L.
How to backtest gold through a release, step by step
CRTLAB marks real economic releases directly on the chart, so you are not cross-referencing a calendar in another tab and guessing which candle was which. Turn the economic calendar overlay on and the high-impact prints appear on the axis as you replay.
The routine that actually teaches you something: pick a month of XAUUSD, set the calendar to high-impact only, and replay at the timeframe you trade. When a marked release comes up, stop. Place the trade you would genuinely have taken beforehand — entry, stop, target, all of it — then step forward one candle at a time and watch what happens to it.
Do that across ten or fifteen releases and you will have something no amount of reading gives you: a real number for how your setup behaves in the only conditions that decide your year. If it survives, you can size properly. If it doesn't, you have learned that for free.
This is also the fastest way to find out whether you should be flat into news at all. Plenty of profitable gold strategies simply stand aside for thirty minutes, and replay will tell you whether that rule costs you anything.
How to backtest gold in CRTLAB
Load XAUUSD, step through real price candle by candle, and log every setup — especially the news-spike losses. The full sample tells you whether your edge is robust to gold's volatility or only works when it's quiet.
The whole gold archive is open from the first chart, and gold is the market that punishes a short sample hardest. It can range for two months inside a few dollars and then add fifty in a session on a headline. Whichever fortnight you happened to sample is almost certainly not representative of the other one.
Nothing here is locked behind a plan. You spend candles as you step them — 10,000 free sample first, or unlimited at $14.99 a month — and stop spending the moment you stop advancing the chart.
Frequently asked questions
What time is gold most volatile?
The New York morning. Over the two years to September 2026, gold's 8:00 to 12:00 New York hours averaged about $23 of range each, against about $14 for London hours and $13 for the afternoon. The single busiest hour was 9:00 to 10:00 New York, which contains the 8:30 data aftermath and the 9:30 US equity open. Measured on 514 trading days of CRTLAB's own gold history.
When does gold usually make its high or low of the day?
Early, more often than people expect. Measured on a New York trading day (18:00 to 17:00), 41% of gold's daily lows and 32% of its daily highs printed in the first six hours after the 18:00 open, and about a quarter of each printed between 8:00 and 12:00 New York. On up days over five years, the low was in before 10:00 New York 93% of the time.
How often does gold take the previous day's high or low?
On most days. Across 1,088 gold trading days from July 2022 to September 2026, on the days that opened inside the previous day's range, gold traded beyond yesterday's high or low by 17:00 New York on 85% and beyond both on only 11%. The nearer level went first about four times in five: from the upper half of yesterday's range, the high was taken on 72% of days and the low on 26%. Once one side was taken, gold took the other as well on just 12% of days.
Should I backtest gold through news releases or skip them?
Through them. Skipping news does not remove the risk from your strategy, it only removes it from your data — your backtested win rate goes up, your drawdown looks tame, and the first live CPI print takes the month back. Replay the release candle by candle with the economic calendar overlay on and find out what actually happens to your stop.
Which timeframe should I backtest XAUUSD on?
The one you trade, and one above it. Gold's intraday range is large enough that a setup which looks clean on 15m can be sitting inside a much uglier 4H structure, and the higher timeframe is usually what decides whether it works. Replaying both is the cheapest way to see the relationship.
Can I backtest gold for free?
CRTLAB is free to try. You get gold across the full archive, with every tool the product has, for your first 10,000 candles of replay — roughly two hours of stepping through a chart, no card needed. After the sample, unlimited replay is $14.99 a month, cancel any time. Silver and WTI crude are open on the same terms if you want to check whether a metals rule is really a metals rule or just a gold rule.
Is gold good to backtest?
Yes — gold's volatility makes it one of the most valuable markets to test, because an untested setup will get punished by its news spikes. Backtesting is how you find out if your edge holds up.
How is gold position size calculated?
One lot of XAUUSD is 100 ounces, so a $1 move is $100 per lot. The position size calculator does the math from your balance, risk and stop distance.