


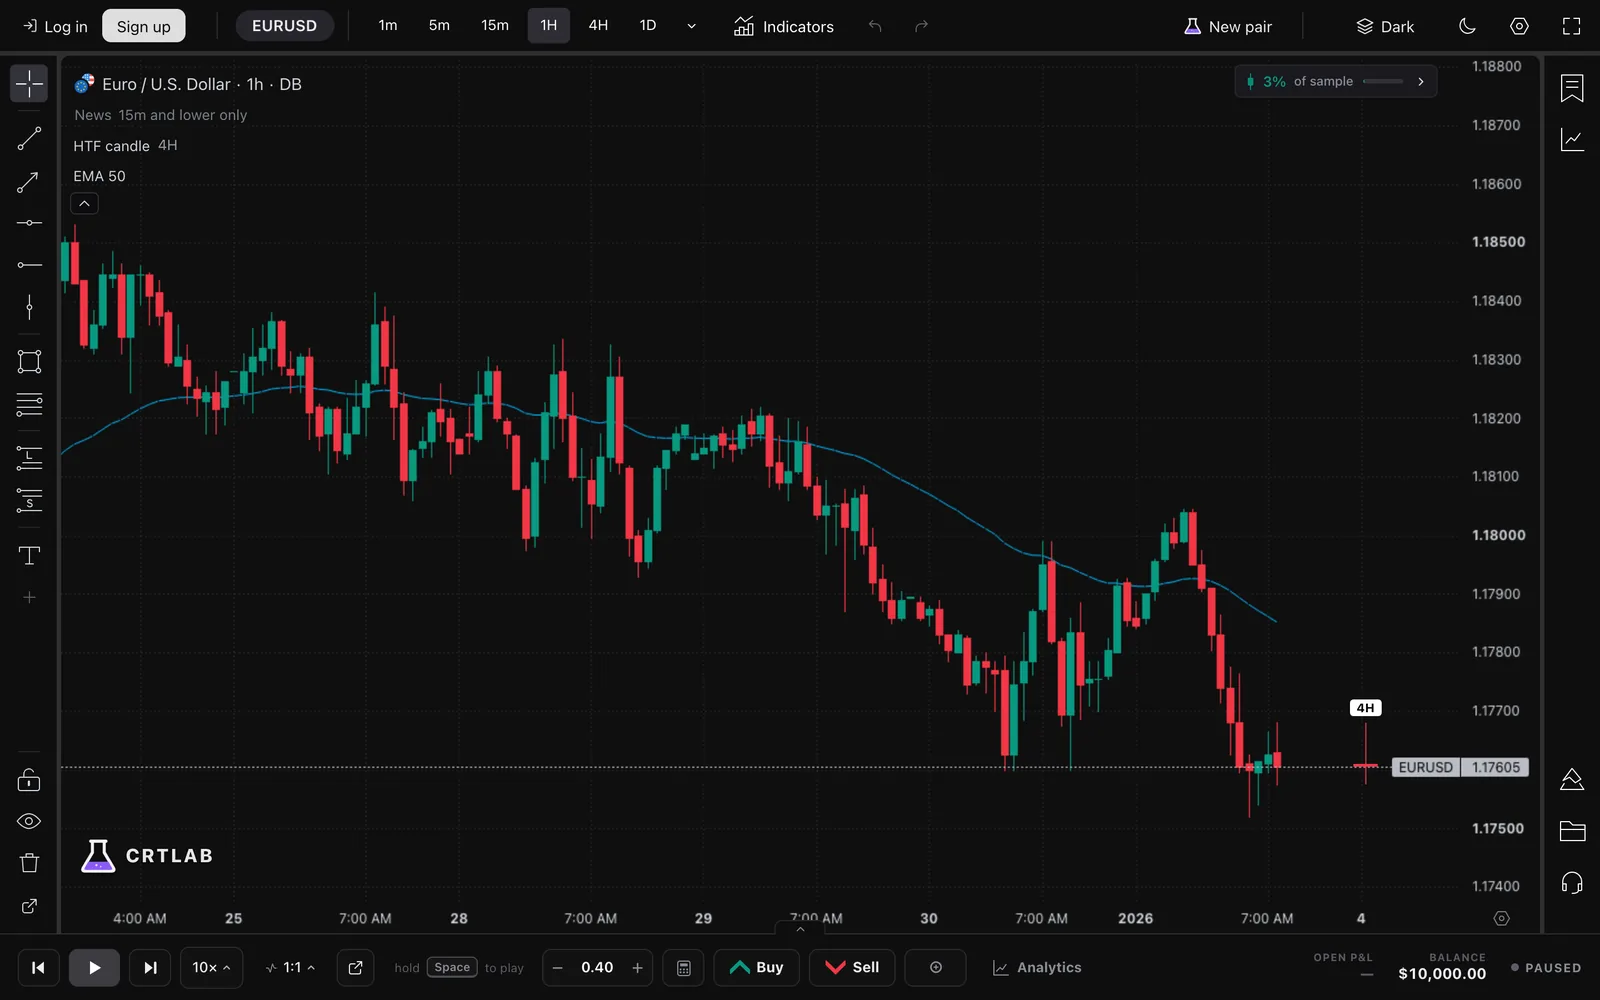
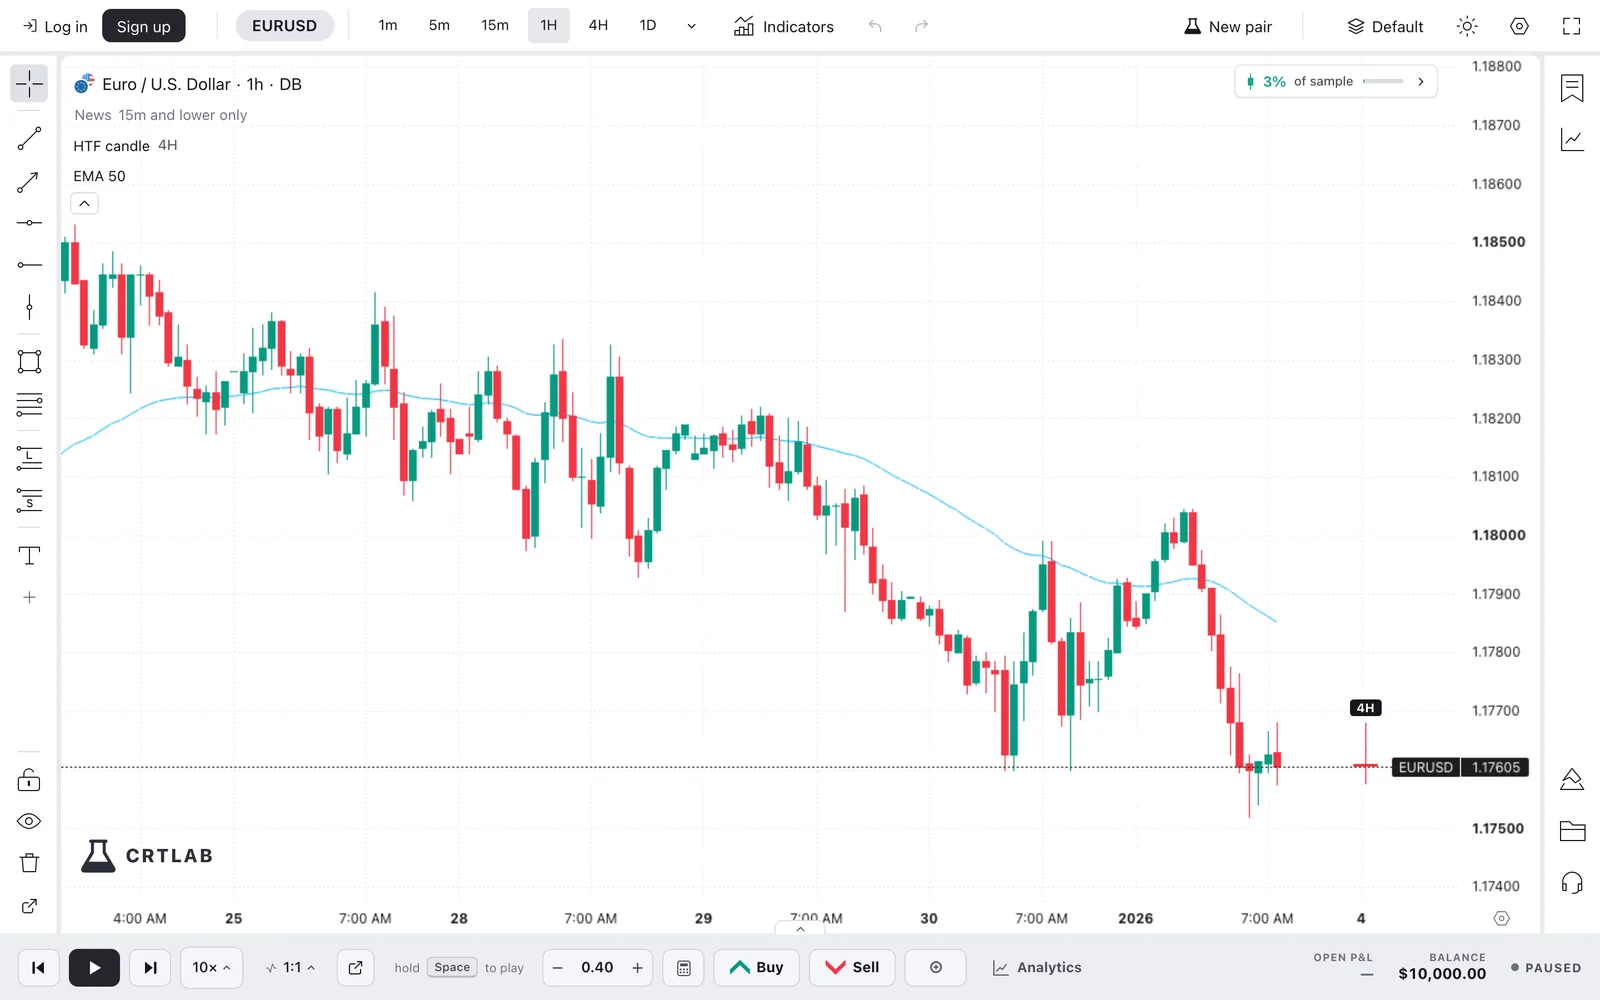
Why backtest EURUSD?
EURUSD gives you the biggest sample of clean setups of any market — it's liquid enough that technical levels behave predictably, so it's the ideal pair to build and prove a repeatable process on. Backtesting it lets you measure your real win rate across hundreds of occurrences instead of trusting a handful of live trades.
It also has a strong session personality: quiet through the Asian hours, then alive through the London open and the London–New York overlap. Replaying those sessions teaches you when your edge actually fires — and when the market is just chopping.
What makes EURUSD different to backtest
The tight spreads and deep liquidity mean EURUSD respects structure more cleanly than exotic or minor pairs — fewer random spikes, more textbook reactions at levels. The trade-off is that the real moves are concentrated in the London and New York sessions; test outside those windows and you're mostly logging noise.
EURUSD moves on ECB and Fed policy, and a pip is 0.0001 — so a 20-pip stop and a 60-pip stop are very different risk. Size each test with the position size calculator so your backtest reflects the real dollar risk you'd take live, and the pip calculator turns any pip move into the dollar figure behind it — $10 per pip per standard lot on EURUSD, fixed.
EUR/USD's day, hour by hour (measured)
We measured every New York trading day in our EUR/USD archive from 19 September 2024 to 18 September 2026: 517 days, hourly bars, the day running 18:00 to 17:00 New York. The average day covered 75.3 pips from high to low, and the median day 66.5. This is how that range was spread across the clock, and where the day's high and low actually printed.
The folklore says London sets the day. The data says New York does. 8:00 to 12:00 New York averaged 21.8 pips an hour against 15.8 for London, and it held 29% of daily highs and lows, more than any other window. London's five hours held only 17% of highs and 14% of lows. The surprise is at the other end of the clock: about a quarter of days set their low in the first six hours after the 18:00 open, and nearly as many their high, and never went back to it.
Two more measured facts worth building rules around. Only 38% of days reached their own 20-day average daily range, so a target that needs the full ADR misses more often than it hits. And by noon New York the median day had already printed its whole range. The range also comes in regimes: April 2025 averaged 144 pips a day, August 2026 only 44, and the 20 days to 18 September averaged 45. The average daily range tool tracks all of that, and the best time to trade tool converts every hour to your own time zone.
| New York time | Avg range per hour | Share of daily highs | Share of daily lows | Test it with |
|---|---|---|---|---|
| 18:00–00:00 (Asia open) | 10.4 pips | 23.2% | 25.9% | Asian range, then the London sweep of it |
| 00:00–03:00 (late Asia) | 11.5 pips | 9.5% | 7.4% | The quietest window for highs and lows |
| 03:00–08:00 (London) | 15.8 pips | 17.0% | 13.7% | London session, the London Open kill zone |
| 08:00–12:00 (New York AM) | 21.8 pips | 28.8% | 29.4% | 8:30 and 10:00 data, New York session, Silver Bullet |
| 12:00–17:00 (New York PM) | 12.4 pips | 20.9% | 23.4% | Key levels into the close |
How to backtest EURUSD in CRTLAB
Load EURUSD, step through real price one candle at a time, and mark your setups exactly as your rules dictate — no scrolling ahead. Log every trade with the session it happened in, then review which session and which conditions your edge works best in.
The full EURUSD archive is open on the first chart. On the most-traded pair on earth that is worth more than it sounds: EURUSD spends long stretches doing almost nothing and then trends for months, and a setup fitted to one of those regimes is usually a losing setup in the other. You cannot see that in a fortnight.
What is metered is replay: 10,000 candles as a free sample, or unlimited at $14.99 a month, cancel any time.
Frequently asked questions
Can I backtest EURUSD for free?
CRTLAB is free to try. You get EURUSD across the full archive, with every tool the product has, for your first 10,000 candles of replay — roughly two hours of stepping through a chart, no card needed. After the sample, unlimited replay is $14.99 a month, cancel any time. The data is built from the 6E futures book rather than a single broker's feed, so the spread and the wicks are the same for everyone testing it.
What's the best session to backtest EURUSD?
The New York morning. Over two years, 8:00–12:00 New York averaged 21.8 pips an hour against 15.8 for London, and held 29% of daily highs and lows, more than any other window. London is second. Do not skip the Asian hours entirely, though: about a quarter of days set their low in the first six hours after the 18:00 open, and nearly as many their high, so mark that range even if you never trade it.
What should I set my EURUSD targets against?
The recent average daily range, not a fixed number of pips. The last 20 days to 18 September 2026 averaged 45 pips a day, against 75 over two years, and only 38% of days reached their own 20-day average. A target sized off what is left of today's range is far more realistic than one that needs a full ADR day.
Do I need to download anything?
No. CRTLAB runs in your browser — pick EURUSD and start replaying in about 30 seconds, no downloads, no MetaTrader, no spreadsheets.