

Indicator · Moving averages
Moving Average Backtester (SMA / EMA / WMA)
The moving average is the first indicator everyone adds and the last one anyone measures. Whether price "respects the 20 EMA" on your instrument is not a matter of taste — it is a bounce rate, and it takes an afternoon of replay to find out.
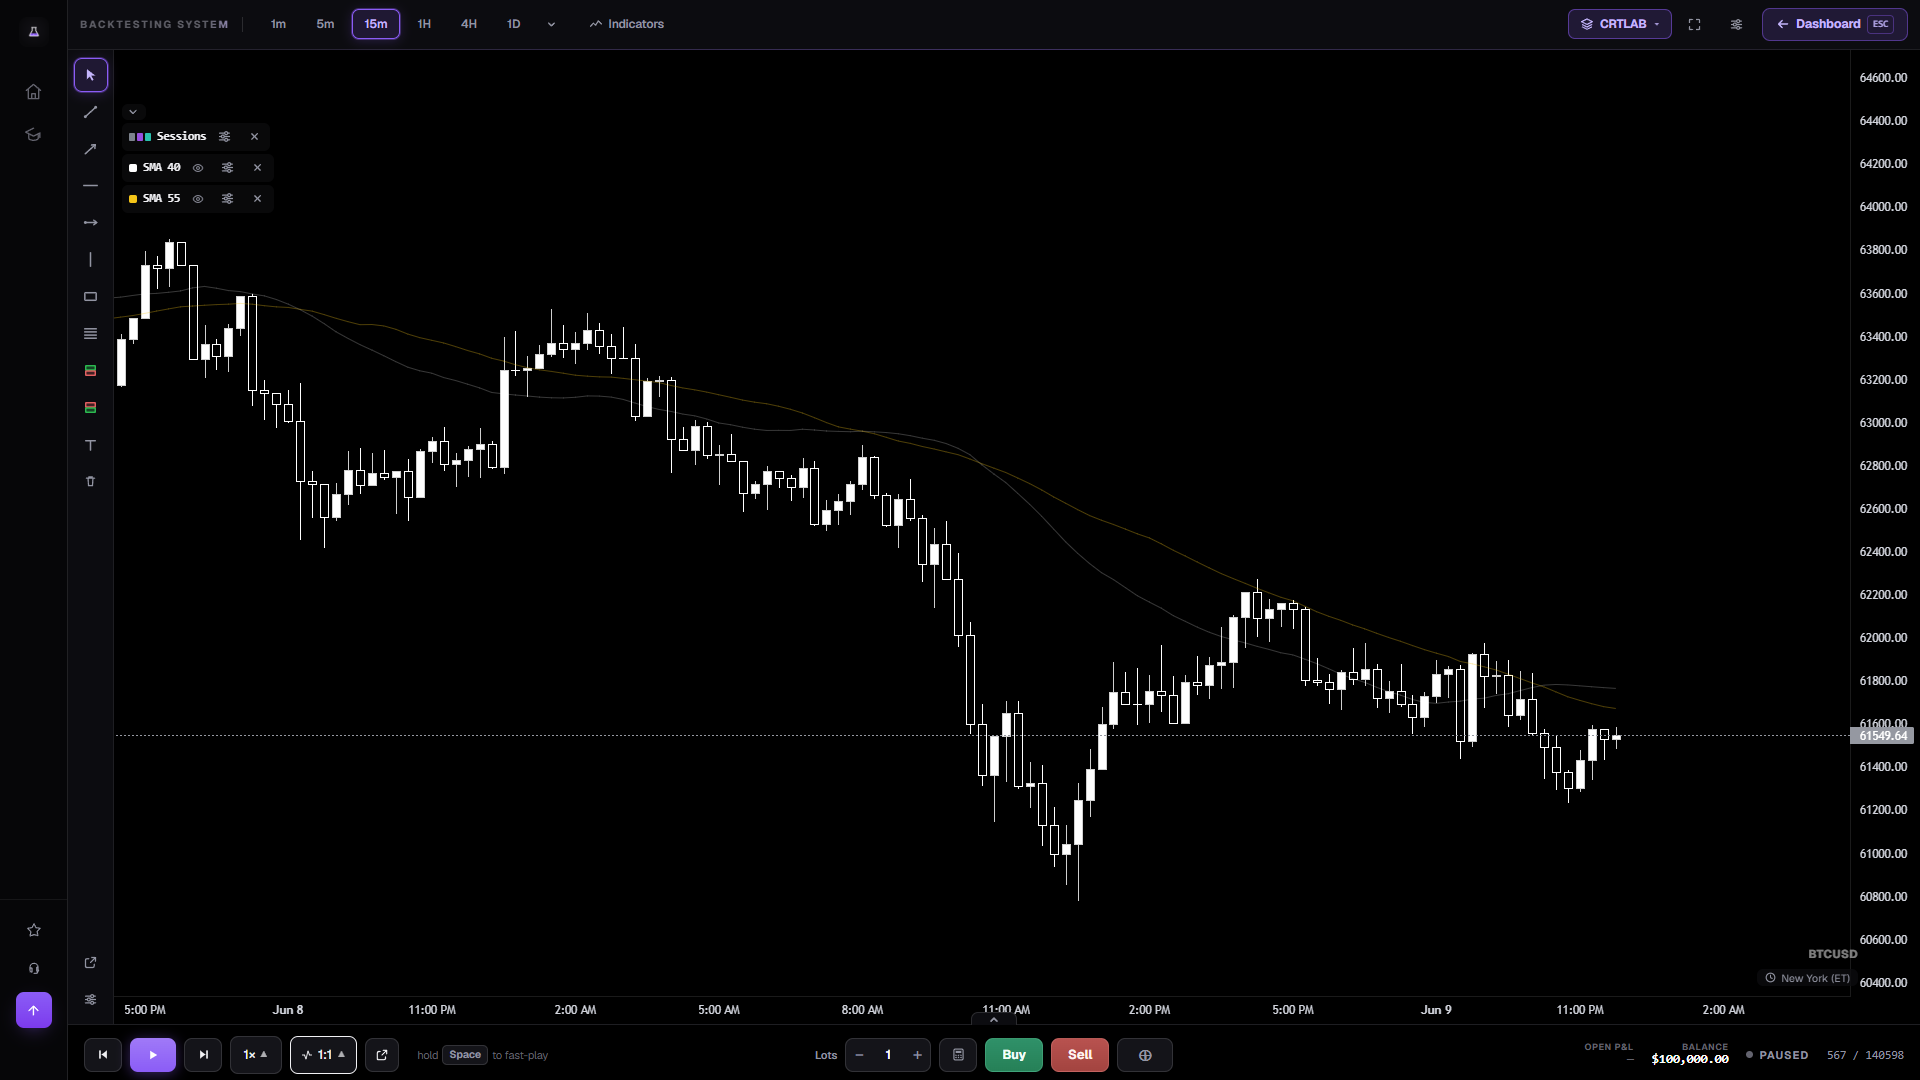
Three averages, three different lags
The simple average weights every candle in its window equally, so it is the smoothest and the slowest, and a single old candle dropping out of the window can move it. The exponential average weights recent candles more heavily — faster to turn, noisier. The weighted average sits between them with a linear taper.
For a dynamic-support test, that lag difference is the entire experiment: a bounce off a 20 EMA and a bounce off a 20 SMA are bounces off two different prices, several ticks apart, and on a stop that tight several ticks is the whole result.
What to measure
Pick one use and test only that. Dynamic support: how often does price touch the average and turn, versus slice through? Trend filter: does taking only longs above the average and shorts below it improve the numbers of a strategy you already have? Mean reversion: how far does price typically extend from the average before returning, on this instrument, on this timeframe?
Those are three separate studies with three separate logs. Running them at once and forming an impression is how everyone ends up believing the 200 EMA is magic on some pairs and useless on others without ever being able to say which.
Frequently asked questions
Which moving average period should I backtest?
The one you already use, first — so the result changes what you do. The common candidates are 9, 20, 21, 50, 100 and 200, and CRTLAB will draw any integer period up to 500.
Can I plot more than one at once?
Yes, and they're drawn in distinct colours so a ribbon of several is readable. If you want two of the same type at different periods, that's exactly what the crossover page opens.
Are moving averages free in CRTLAB?
Yes — every built-in indicator is free on every market. The paid line is CRTLAB's own overlays, like the economic calendar and kill-zone shading, not the standard studies list.
Open EURUSD with a 20 EMA and 50 SMA on
One click — 15-minute euro, both averages plotted, stepping candle by candle.
Open the chart →