

Custom indicators
Create Your Own Indicator — and Actually Test It
Every charting platform has a few hundred indicators and none of them is the one in your head. CRTLAB lets you write it — a few lines in the browser — and then do the thing that matters: replay real history candle by candle and watch whether it holds up.
Why write your own instead of using a built-in
Built-in indicators are built for everybody, which is another way of saying they are built for nobody in particular. The moment your idea has a condition in it — only when the previous day's range was under X, only in the first hour, only when these two things line up — there is no dropdown for that. There never will be.
Most traders solve this by eyeballing it, which works right up until the sample gets big enough to matter. Writing it down forces the idea to become specific, and a specific idea is one you can measure. Half the value is in the writing: a rule you cannot express in five lines is usually a rule you have not actually decided on yet.
What writing one actually looks like
It is plain JavaScript with a charting library already loaded — sma, ema, atr, rsi, highest, lowest, stdev and the rest — plus open, high, low, close and time as arrays, one value per bar. Two moving averages is four lines. A volatility band is six.
You declare your plots in a short header, so the chart knows the shape of what you are drawing before it runs anything. Inputs you declare there become real number fields in the settings cog, exactly like a built-in indicator's length — so you can tune it on the chart afterwards rather than editing code every time.
If you would rather not start from a blank box, there are templates: a moving-average cross, volatility bands, an oscillator in its own pane, and a bare bar-by-bar loop for when the helpers are not enough.
Two things that stop a custom indicator lying to you
It is checked for lookahead. The single most common bug in a hand-written indicator is one that reads a bar it could not have known about yet — and it never announces itself, it just makes your backtest look brilliant. Every script is run twice, once over the full history and once over a prefix, and the two are compared. A value that changes when the future is removed read the future, and you are told so before it goes on the chart.
It runs in a sandbox with a time limit. Your script executes off the main thread, so a loop that never ends costs you an error message rather than a frozen tab. It also cannot reach the network or the page — it does maths on bars and returns numbers, and that is all it can do.
Neither of these is a nice-to-have. An indicator you do not trust is worse than no indicator, because you will trade it anyway.
The part that makes it worth doing: replay
Drawing an indicator on a finished chart tells you almost nothing — of course it looks good, you are seeing the answer and the working at the same time. The test is watching it form.
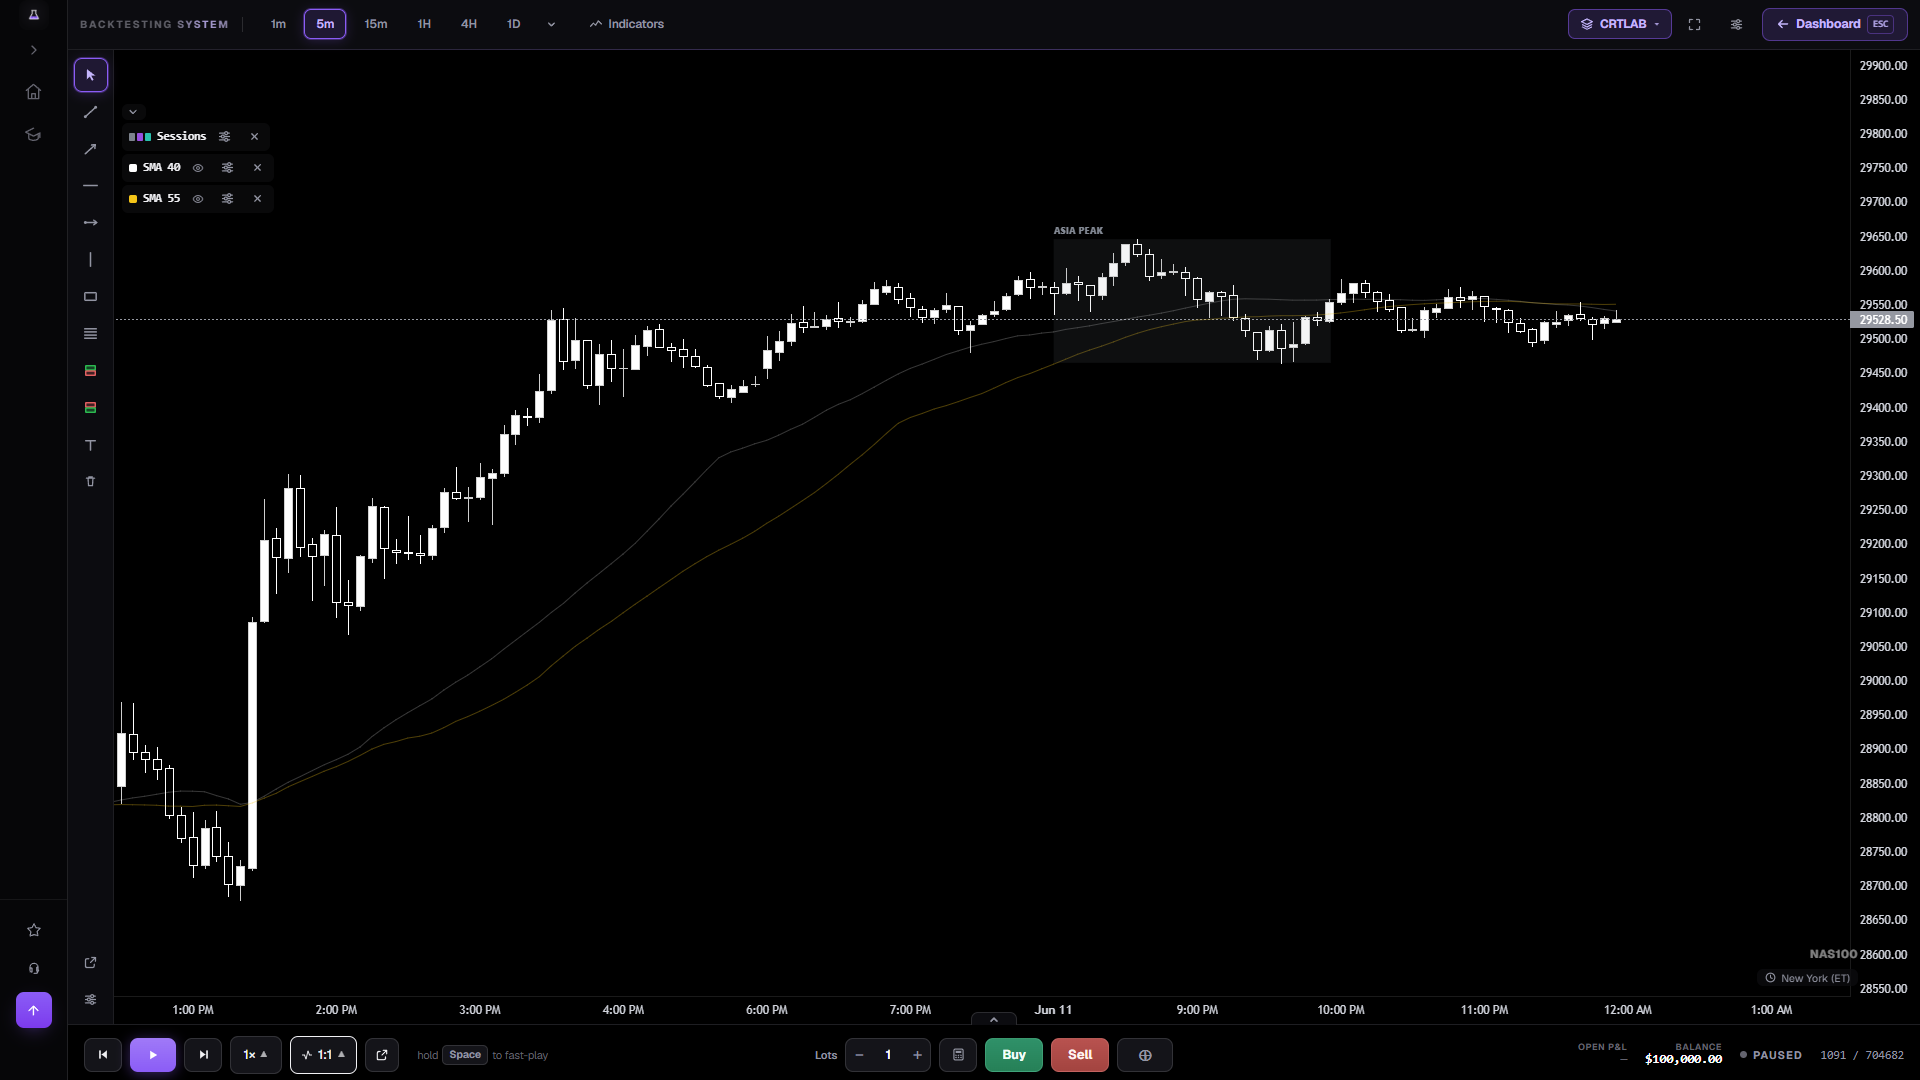
A personal indicator behaves like any built-in one during replay: it appears in the legend with an eye and a settings cog, takes your colours, respects your per-timeframe visibility rules, and is saved with your chart. Step forward candle by candle and you see it develop in real time, with no idea what the next bar does — which is the only condition your live trading will ever run in.
It costs nothing per candle to run, either. The script is computed once when you save it and the replay just reveals the next value, so a heavy indicator does not slow the chart down.
Frequently asked questions
Do I need to know how to code?
Barely. A two-moving-average indicator is four lines, and every template is a working script you can change one number in. If you have ever edited a spreadsheet formula you will manage this.
Is it Pine Script?
No — it is JavaScript with a trading library already loaded. Pine's syntax is not what makes it easy, its standard library is, so that is the part CRTLAB copied. If you know Pine you will recognise nearly everything: `close`, `sma()`, `atr()`, declared inputs and plots.
Where are my indicators saved?
In your browser, alongside your chart layout and colours, so they are there next time you open the app. They are personal — nothing is published or shared with anyone else.
Can I use a custom indicator while replaying history?
That is the point of it. It draws on the replay exactly like a built-in study, updating one candle at a time as you step forward, so you can watch it form without knowing what happens next.
Is it free?
Yes, and there is no card and no trial timer. You get every market in the catalogue, with every tool the product has, for 2,000 candles of replay — about two hours of stepping through a chart. After that you top up for $5, or pay $19.99 once and never think about it again. Nothing you buy expires. Custom indicators are not a paid add-on — writing one and replaying it costs the same as using a built-in moving average.
Write it, then find out if it works
Open a chart, write your indicator, and replay real history candle by candle. Free to start, no card.
Open the chart →