

Backtest · QCOM
Backtest QCOM — Candle by Candle
Qualcomm is the semiconductor that spends the most time going nowhere, and that makes it the most useful name in this list for one specific job: finding out whether your mean-reversion rule is a strategy or a survivorship story. Range-bound instruments are where fade rules make their money, and they are also where the ones that only worked in hindsight are exposed fastest.
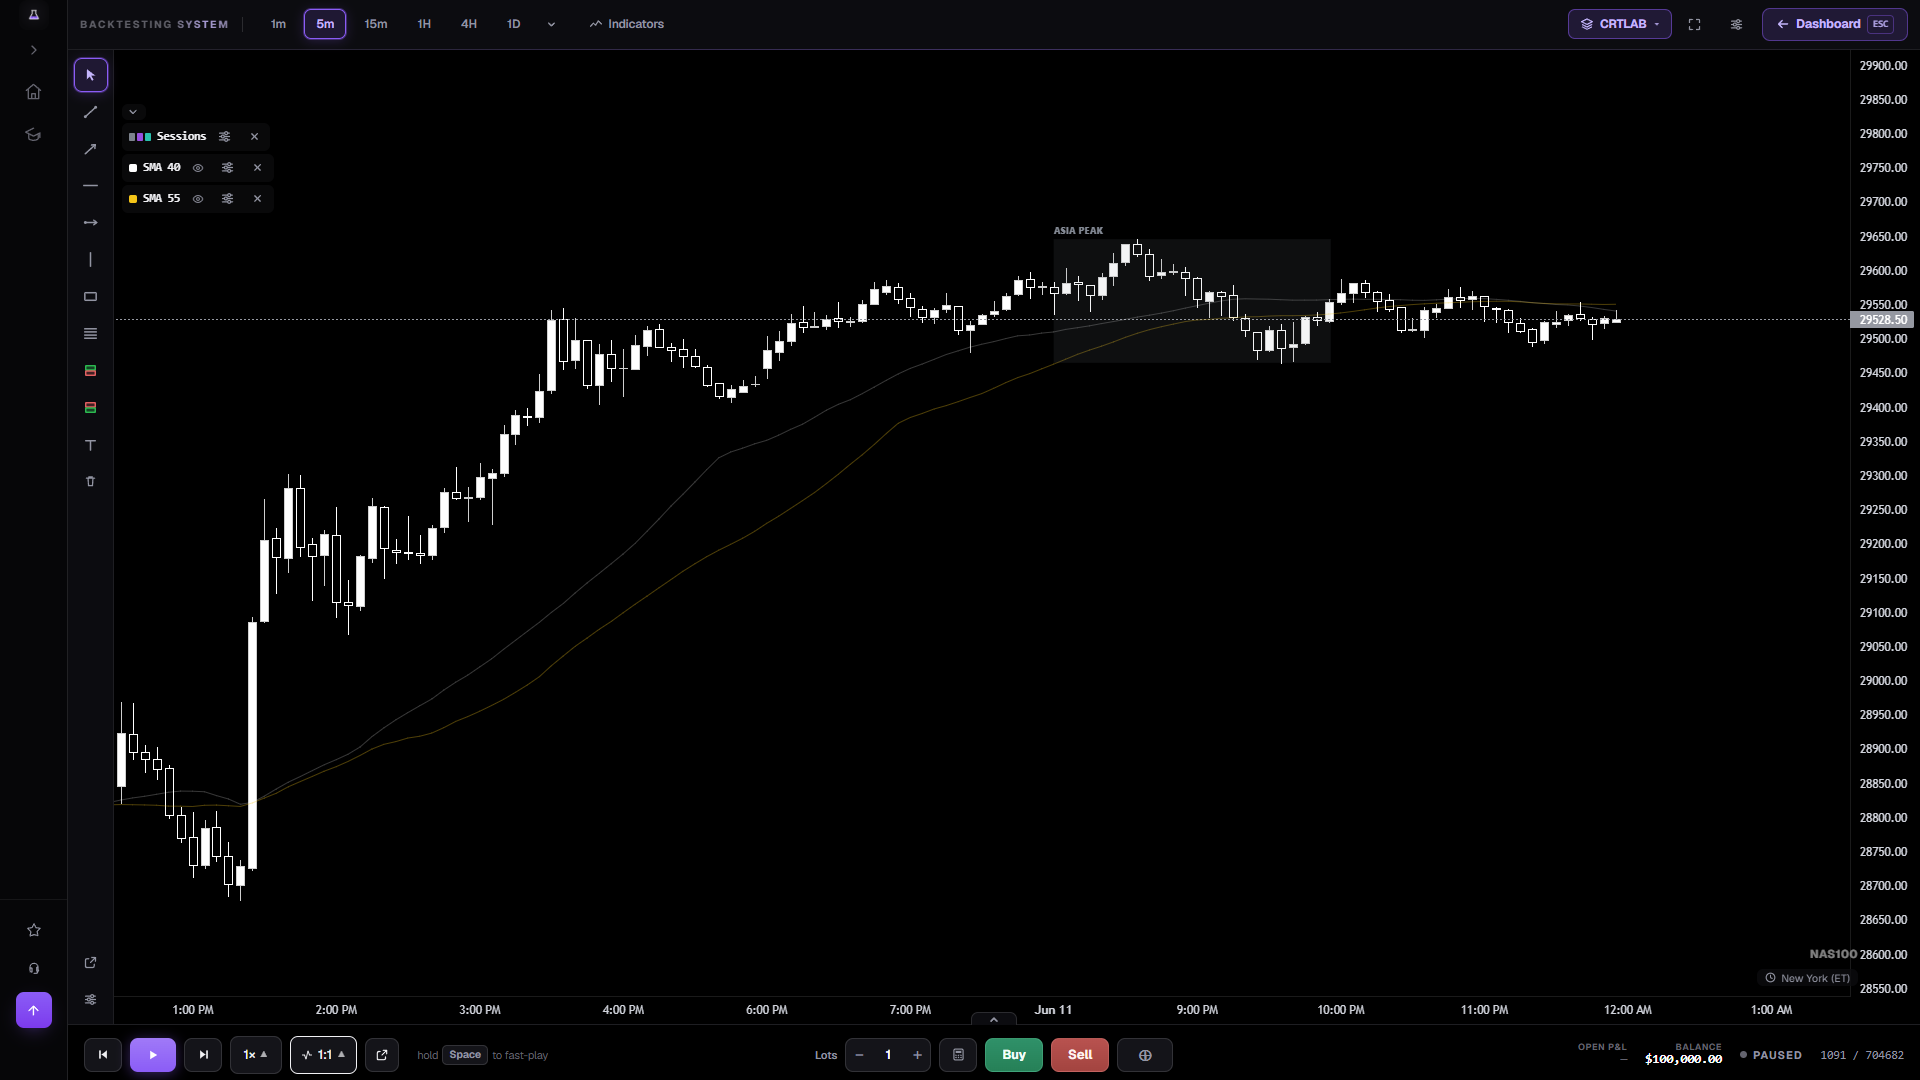
Where a fade rule has to prove itself
The honest difficulty with mean reversion is that you cannot know a range is a range until it ends, and by then the profitable trades are obvious. A replay is the only setting where you have to commit to the fade at the level with the right-hand side hidden — which is where most fade rules turn out to have an unwritten filter in them along the lines of "unless it is about to break out".
QCOM gives you a lot of those decisions across eight years, which is what makes the sample worth anything. Fade rules typically have a high win rate and a poor payoff ratio, so the number that decides whether they work is not the win rate at all — it is what the losses cost when the range finally ends.
Record the biggest loser separately from the average. On a fade strategy the tail is the entire risk, and a summary that reports only the mean is hiding the thing that eventually decides the outcome.
What the QCOM data actually is
The archive runs from May 2018 to the most recent session we hold, on every timeframe from one minute to monthly. It is open from the first chart — there is no plan that unlocks more of it, and no shorter window for people who have not paid.
Equity data here is regular hours only — 09:30 to 16:00 New York, no pre-market and no after-hours. That is not a gap in the data, it is what an equity session is, and it has a consequence worth planning for: every trading day opens with a gap rather than continuing from the previous close, so any rule you carried over from an index future or an FX pair is about to meet a discontinuity it has never been tested against.
Prices are split-adjusted throughout, so a chart of 2019 shows what you would compare against today rather than the raw tape. Getting this wrong is the classic silent equity-backtest bug: an unadjusted series prints a 90% single-day crash on the split date, and a stop-loss rule tested through it produces numbers that mean nothing.
How to backtest QCOM without fooling yourself
Write the invalidation before the entry. "I fade the level unless price closes beyond it by X" is testable; "I fade the level unless it looks like a breakout" is not.
Count losses in R and look at the distribution rather than the average. The risk/reward calculator will tell you what win rate a given payoff ratio needs, which is the honest bar your fade rule has to clear.
Then take the same rules to MSFT, which trends. A fade rule that survives both is unusual and worth keeping; one that only works here is a range bet.
Frequently asked questions
Is QCOM backtesting free?
Yes, and there is no card and no trial timer. You get Qualcomm back to May 2018, with every tool the product has, for 2,000 candles of replay — about two hours of stepping through a chart. After that you top up for $5, or pay $19.99 once and never think about it again. Nothing you buy expires. Eight years of a frequently range-bound instrument is a large sample for a fade rule, which is what those rules need most.
Why is QCOM good for testing mean reversion?
Because it spends unusually long stretches range-bound, so the setup actually occurs often enough to build a real sample — and because those ranges eventually end, which is where a fade rule's real risk lives and where hindsight testing quietly hides it.
What number matters most on a fade strategy?
Not the win rate. Fade rules typically win often and lose big, so the deciding figure is the size of the worst losses relative to the average win. Record the tail separately rather than letting an average absorb it.
How far back does QCOM go?
May 2018, split-adjusted, regular hours only, on every timeframe from one minute to monthly.
Open QCOM and start stepping
Real Qualcomm history, split-adjusted, one candle at a time. No account, no card, 2,000 candles free.
Open the chart →