

Backtest · AVGO
Backtest AVGO — Candle by Candle
Broadcom is the semiconductor that does not behave like one for long stretches, and then abruptly does. For years it traded closer to a steady large-cap compounder than to the cyclical swings of Micron or AMD — and then it re-rated. A rule calibrated on AVGO's quiet years meets a completely different instrument in its loud ones, which makes it a good test of whether your strategy adapts or breaks.
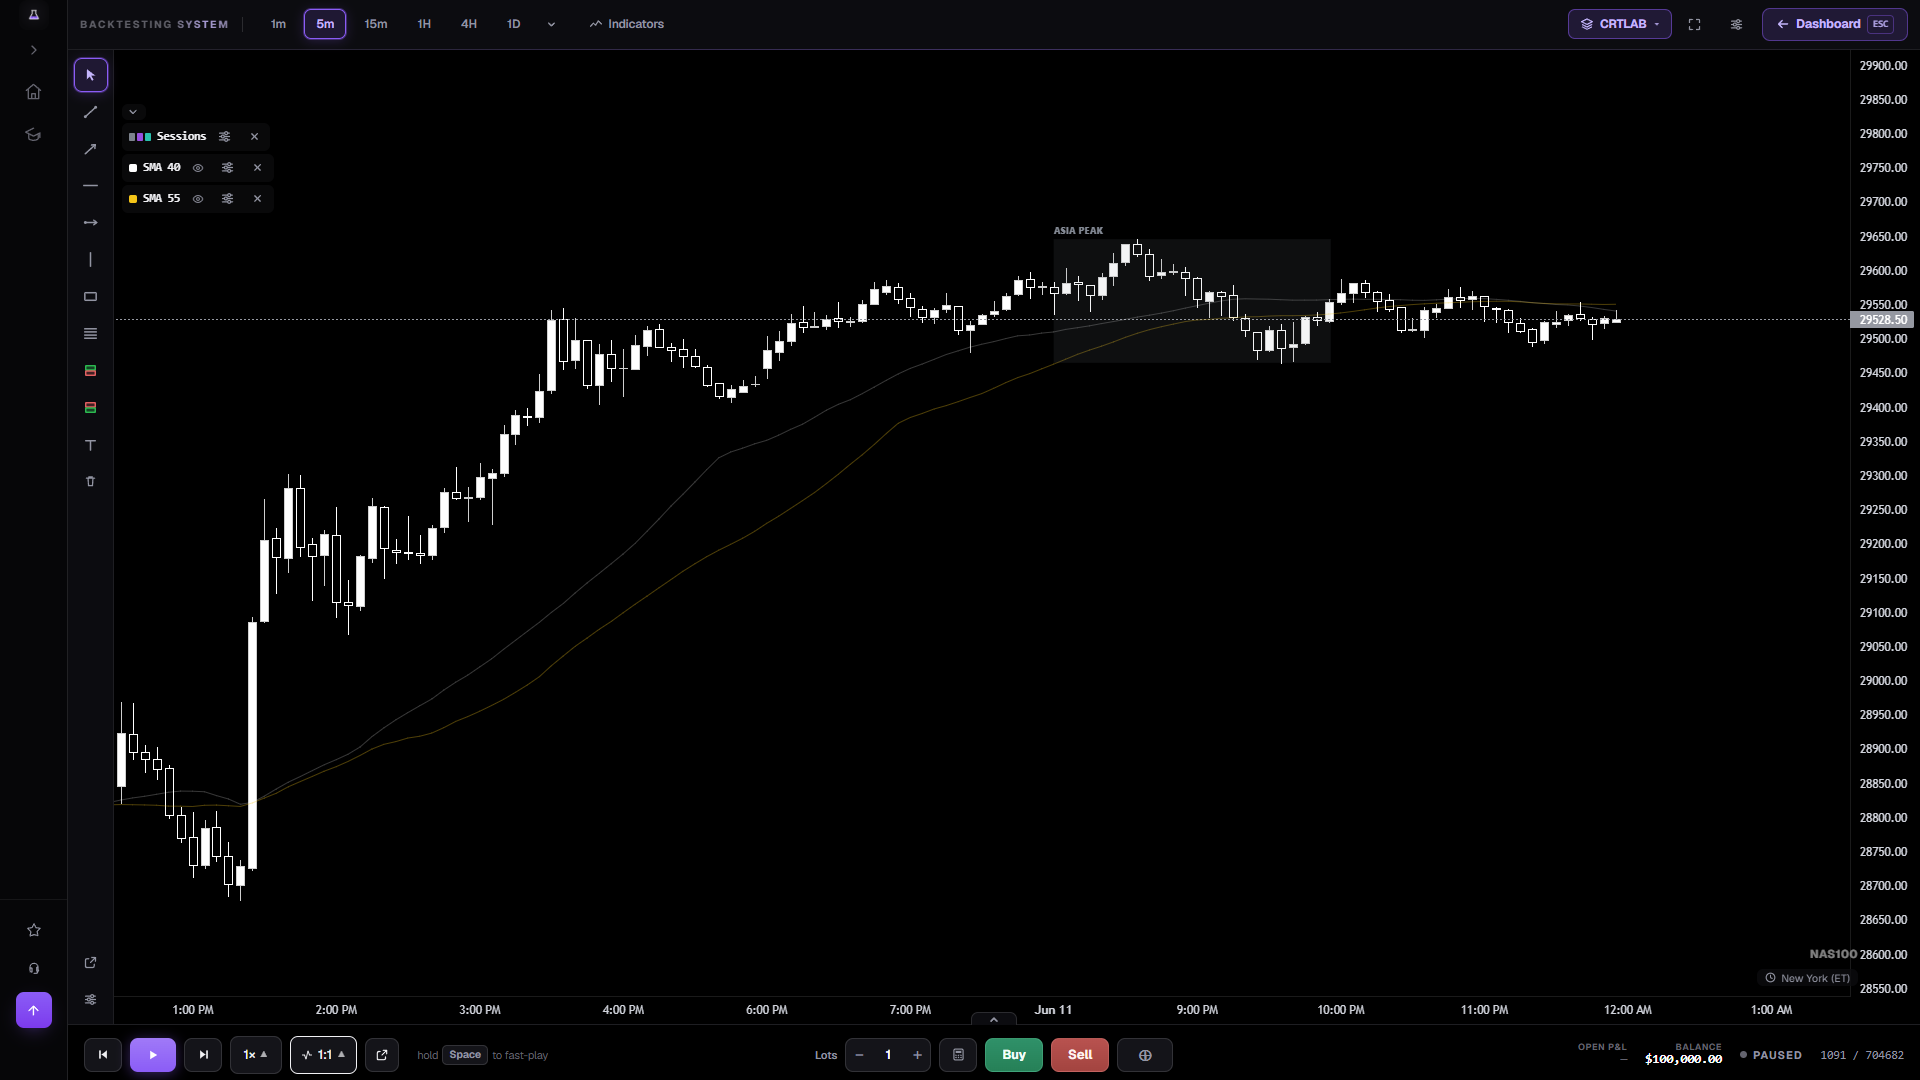
The instrument that changes character mid-archive
Most backtests implicitly assume the instrument is one thing throughout the sample. AVGO is a clean counterexample within a single ticker, and you can measure it directly: compute your average trade result year by year rather than over the whole file, and look at whether the good years are clustered.
If they are, you have learned something more useful than a win rate. You have learned that your edge has a market-condition dependency, and you can then go and test what that condition actually is — range expansion, sector momentum, or simply a trend being underway.
The mechanics: AVGO split 10-for-1 in July 2024 and the archive is back-adjusted, so pre-split bars sit around a tenth of the tape. Work in R rather than dollars and it makes no difference to your results.
What the AVGO data actually is
The archive runs from May 2018 to the most recent session we hold, on every timeframe from one minute to monthly. It is open from the first chart — there is no plan that unlocks more of it, and no shorter window for people who have not paid.
Equity data here is regular hours only — 09:30 to 16:00 New York, no pre-market and no after-hours. That is not a gap in the data, it is what an equity session is, and it has a consequence worth planning for: every trading day opens with a gap rather than continuing from the previous close, so any rule you carried over from an index future or an FX pair is about to meet a discontinuity it has never been tested against.
Prices are split-adjusted throughout, so a chart of 2019 shows what you would compare against today rather than the raw tape. Getting this wrong is the classic silent equity-backtest bug: an unadjusted series prints a 90% single-day crash on the split date, and a stop-loss rule tested through it produces numbers that mean nothing.
How to backtest AVGO without fooling yourself
Break the result down by year before you draw any conclusion. A single aggregate number over eight years hides exactly the pattern this instrument exists to reveal.
Then test the same rules on QCOM, which spent much of the same period range-bound. If your strategy works on both, the condition dependency is smaller than you feared.
Size with the position size calculator and log in R — the 10-for-1 adjustment makes dollar-denominated results incomparable across the split date.
Frequently asked questions
Is AVGO backtesting free?
Yes, and there is no card and no trial timer. You get Broadcom back to May 2018, with every tool the product has, for 2,000 candles of replay — about two hours of stepping through a chart. After that you top up for $5, or pay $19.99 once and never think about it again. Nothing you buy expires. The 10-for-1 split of July 2024 is back-adjusted, so the series is continuous through it.
Why do AVGO prices before 2024 look so low?
Because of the 10-for-1 split in July 2024. Every earlier bar is divided by ten so percentage moves stay comparable; without that adjustment the split date would print a 90% single-session fall and break every stop test running through it.
Is Broadcom a good proxy for the semiconductor sector?
Only partly, which is what makes it interesting. It spent long stretches trading more like a steady large cap than like a cyclical chip name, then re-rated — so treating it as interchangeable with NVDA or AMD in a sector test will distort the result.
How far back does AVGO go?
May 2018, regular hours only, on every timeframe from one minute to monthly.
Open AVGO and start stepping
Real Broadcom history, split-adjusted, one candle at a time. No account, no card, 2,000 candles free.
Open the chart →