

Backtest · MSFT
Backtest MSFT — Candle by Candle
Microsoft is the stock that will tell you whether you have a trend rule or a mean-reversion rule, because it is unusually bad at rewarding the wrong one. It grinds. Long stretches of this archive are a series of small higher highs with shallow pullbacks, which is the exact condition that makes a mean-reversion strategy bleed out slowly rather than failing in a way you would notice.
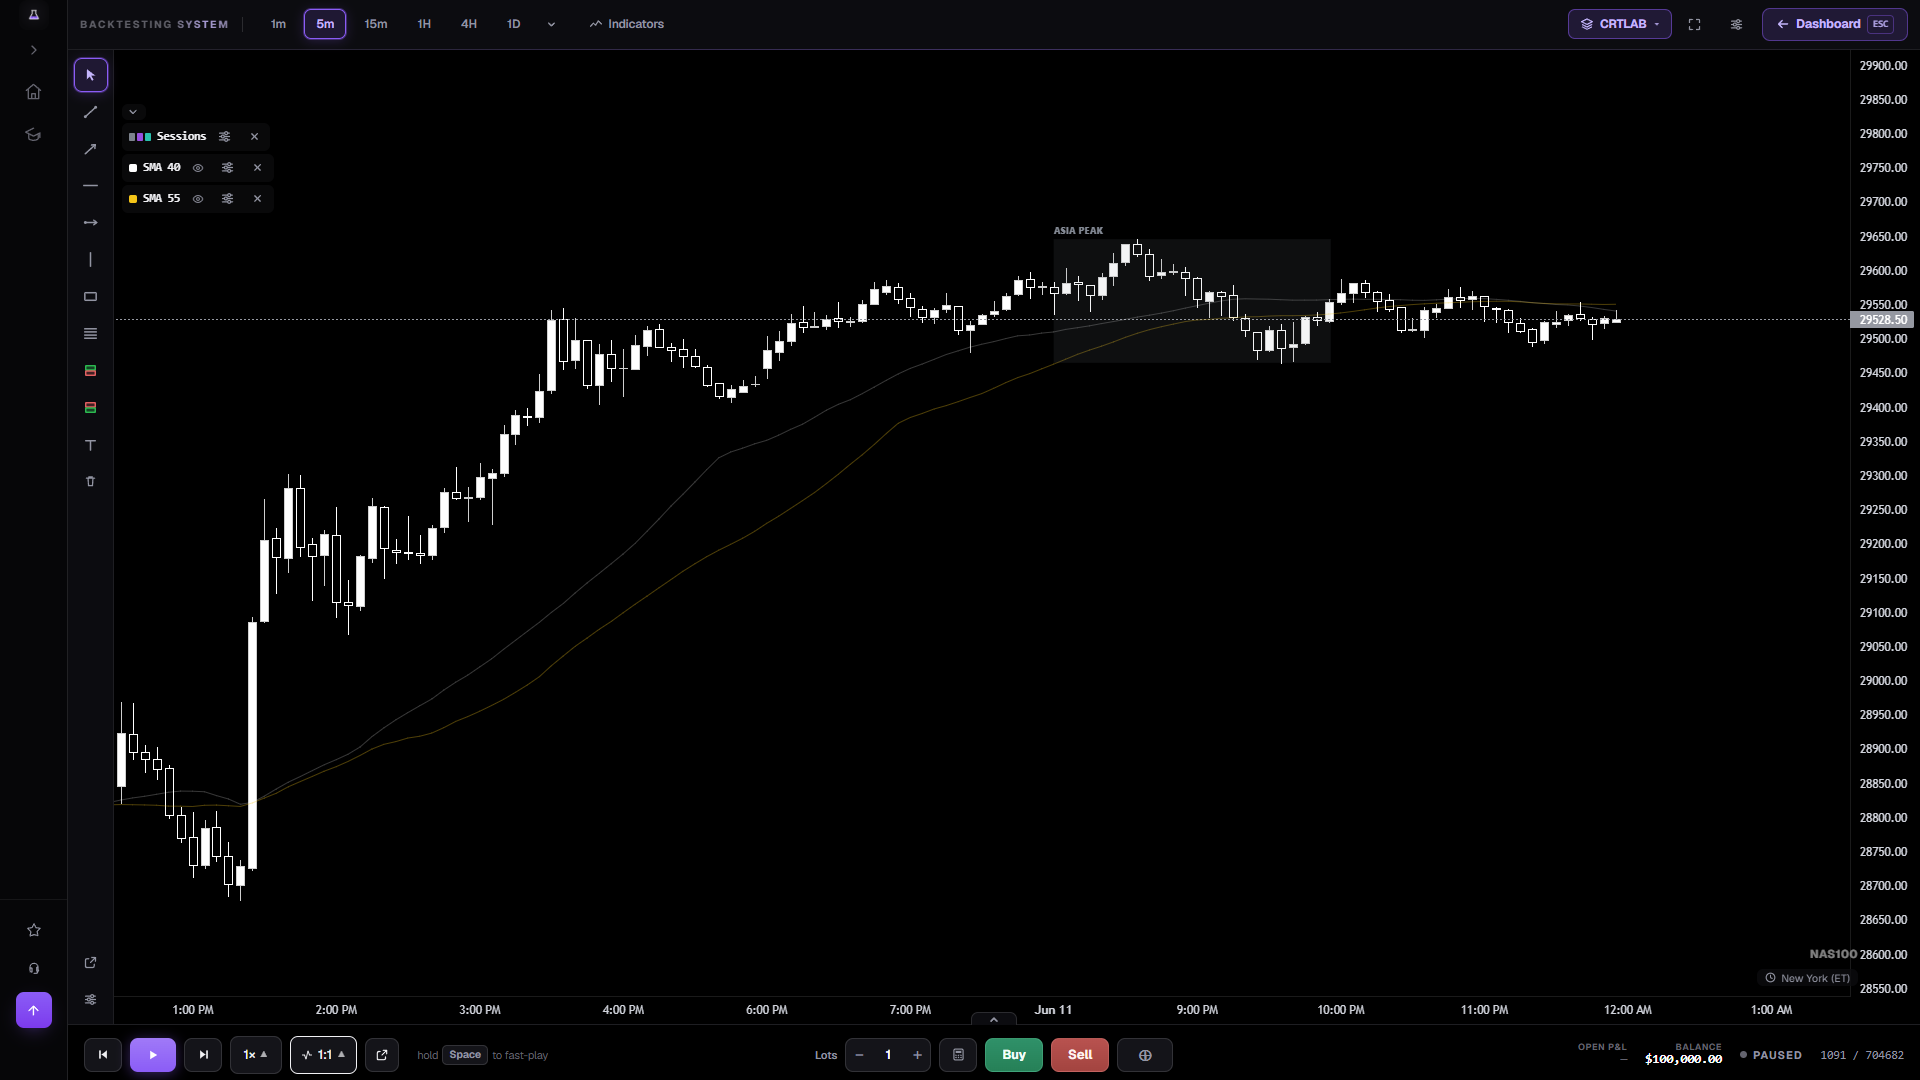
Slow bleed is harder to spot than a blow-up
A strategy that loses 20% in a week gets abandoned. A strategy that loses 0.3% a week for a year does not, because every individual loss looks like noise. MSFT's character makes it the best instrument in this list for exposing the second kind, and the way to see it is to plot the equity curve of your test rather than reading the summary win rate.
It is also the cleanest place to test a pullback entry. Microsoft's pullbacks in an uptrend are typically shallow and short, so a rule that waits for a deep retracement will simply not fire — and "my setup did not appear for eleven months" is a result worth knowing before you commit to it live.
There are no splits in this window, which is a small mercy and worth saying: it makes MSFT the simplest series here to reason about, with no adjustment artefacts to explain away.
What the MSFT data actually is
The archive runs from May 2018 to the most recent session we hold, on every timeframe from one minute to monthly. It is open from the first chart — there is no plan that unlocks more of it, and no shorter window for people who have not paid.
Equity data here is regular hours only — 09:30 to 16:00 New York, no pre-market and no after-hours. That is not a gap in the data, it is what an equity session is, and it has a consequence worth planning for: every trading day opens with a gap rather than continuing from the previous close, so any rule you carried over from an index future or an FX pair is about to meet a discontinuity it has never been tested against.
Prices are split-adjusted throughout, so a chart of 2019 shows what you would compare against today rather than the raw tape. Getting this wrong is the classic silent equity-backtest bug: an unadjusted series prints a 90% single-day crash on the split date, and a stop-loss rule tested through it produces numbers that mean nothing.
How to backtest MSFT without fooling yourself
Test a trend rule and a fade rule on the same stretch and compare the two equity curves side by side. On most instruments one of them is obviously better; the useful part is finding out by how much, and in which years.
Count non-occurrences as data. If your entry needed a 5% pullback and MSFT gave you four in eight years, the strategy is not wrong — it is just not a Microsoft strategy, and that is worth knowing before you wait for it live.
Take the same rules to INTC afterwards. Same sector, same index, opposite trajectory — it is the sharpest available test of whether your rule cuts losers or rides them.
Frequently asked questions
Is MSFT backtesting free?
Yes, and there is no card and no trial timer. You get Microsoft back to May 2018, with every tool the product has, for 2,000 candles of replay — about two hours of stepping through a chart. After that you top up for $5, or pay $19.99 once and never think about it again. Nothing you buy expires. There are no splits in this window, so the series is as clean as anything in the catalogue.
What is MSFT good for testing specifically?
Trend continuation and pullback entries. Its habit of grinding upward with shallow retracements means a rule requiring a deep pullback will rarely trigger, and a mean-reversion rule will lose slowly rather than dramatically — both findings you want from a replay rather than from a live account.
Does the data include after-hours moves?
No, regular session only. Microsoft reports after the close, so the earnings reaction arrives as an opening gap the next morning rather than as a visible move — which is exactly how it would reach a position you held overnight.
How many years of MSFT history are there?
From May 2018, on every timeframe from one minute to monthly. It covers the 2020 crash, the 2022 drawdown and two extended uptrends.
Open MSFT and start stepping
Real Microsoft history, split-adjusted, one candle at a time. No account, no card, 2,000 candles free.
Open the chart →