

Indicator · Supertrend
Supertrend Backtester
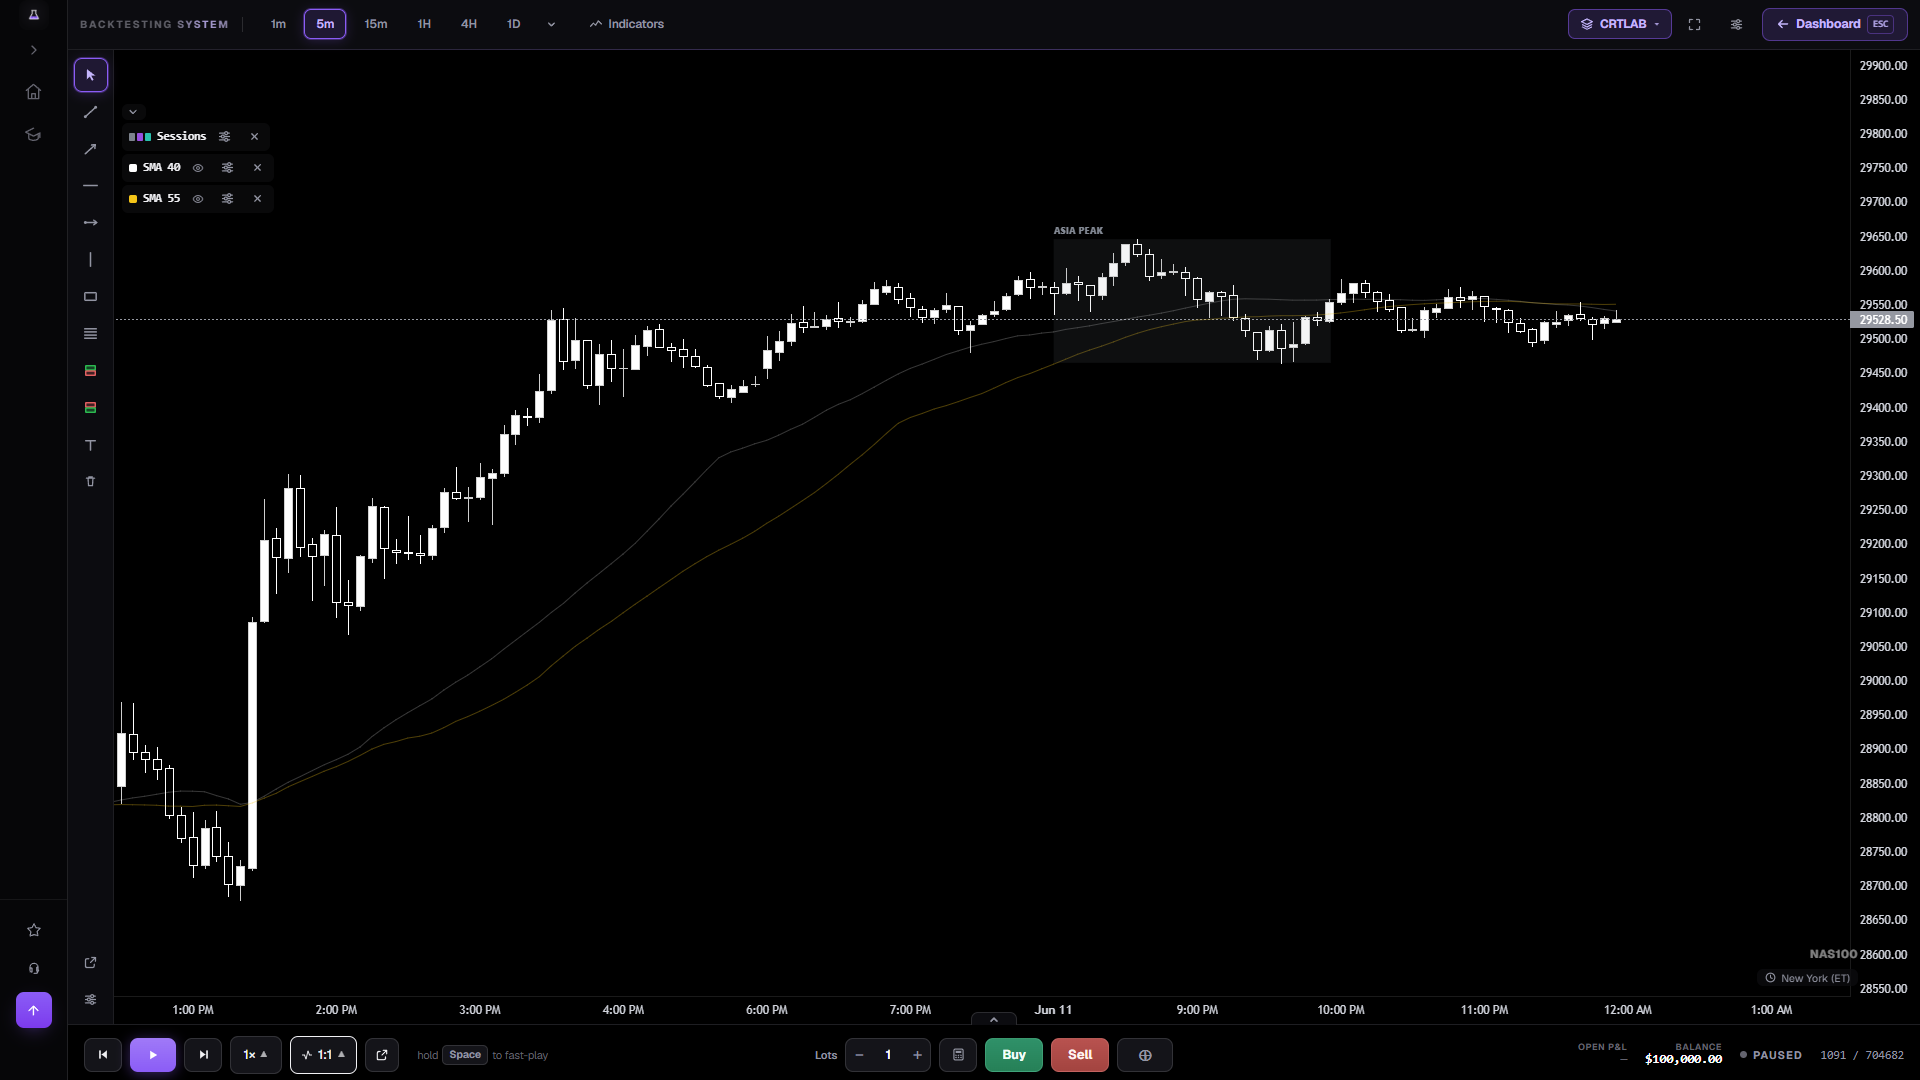
Supertrend looks flawless on a chart you're scrolling backwards. It flips, price runs, it flips again. Step through the same chart forwards, one candle at a time, and you meet the part the screenshots leave out: the whipsaw stretches where it flips four times in an hour. This is where you find out how many of those your account survives.
The two settings that are the whole strategy
Supertrend is an ATR band: period sets how much history the volatility estimate uses, multiplier sets how far the band sits from price. CRTLAB defaults to 10 and 3, which is the common starting point — and the first thing any honest test does is change them.
A low multiplier flips constantly and catches every move early, including the fifty that aren't moves. A high one flips rarely and gives back a large chunk of each trend before it admits the trend ended. There is no correct answer, only a trade-off, and the shape of that trade-off is different on every instrument. That is the finding worth having, and it takes about an hour to get.
How to test it without fooling yourself
Pick one setting pair. Run 100 signals. Write down the result. Then change one number and run 100 more. The failure mode here is tweaking the multiplier mid-run whenever it whipsaws — which produces a set of parameters fitted precisely to the two weeks you happened to test, and to nothing else.
Test the parameters on one stretch of history and then check them on a different stretch you haven't looked at. That is out-of-sample testing, and for an indicator with two tunable knobs it is not optional — two knobs is more than enough to curve-fit with.
Where Supertrend earns its keep
Trending instruments, on timeframes high enough that the flips are rare. It is at its worst in a range, and index futures spend a great deal of the day ranging — so backtesting it on a 1-minute NAS100 chart and on a 4-hour gold chart will produce results so different you'd think it was two indicators. Run both.
Pair the test with the risk/reward calculator: a trend follower with a 35% win rate is perfectly healthy if the winners are large, and completely fatal if they aren't. The win rate alone tells you nothing here.
Frequently asked questions
Can I change the Supertrend period and multiplier?
Yes — both are editable from the chart legend, and the indicator redraws over the whole replay immediately, so comparing settings is a few seconds rather than a rebuild.
Is the Supertrend indicator free?
Yes. Every built-in indicator in CRTLAB is free — moving averages, Supertrend, Bollinger Bands, Ichimoku and the rest. Gating a moving average reads as meanness rather than value.
Does Supertrend repaint?
The current, unclosed candle's band can move while that candle is still forming — that is true of every ATR-based indicator. In replay you step candle by candle, so you see the value at each close and never a value derived from a future bar.
What timeframe is best for Supertrend?
Higher than you think. Flip frequency scales with how noisy the timeframe is, so most of the value of a Supertrend backtest is discovering the timeframe below which the whipsaw cost exceeds the trend capture on your instrument.
Open a chart with Supertrend already plotted
One click — NAS100, 15-minute, Supertrend on. Change the settings and re-run in seconds.
Open the chart →