

Indicator · MA crossover
Moving Average Crossover Backtester
The 50/200 crossover is the most famous signal in trading and one of the most casually repeated. "The golden cross is bullish" is a claim with a hit rate attached, and the hit rate is not hard to obtain — it just requires stepping through the chart forwards instead of pointing at the two times it worked.
What the crossover really is
A slow average and a fast one. When the fast crosses above the slow, the recent trend has outpaced the longer one; that is the entire information content. The golden cross (50 above 200) and death cross (50 below 200) are just this on daily equity charts, with a name attached by financial television.
Because it's lagging by construction, the crossover is never early. What a backtest measures is whether being late is a price worth paying for being right more often — and that answer swings hard between trending and ranging regimes, which is precisely why testing it on two weeks of one market tells you nothing.
Test the variants, not the folklore
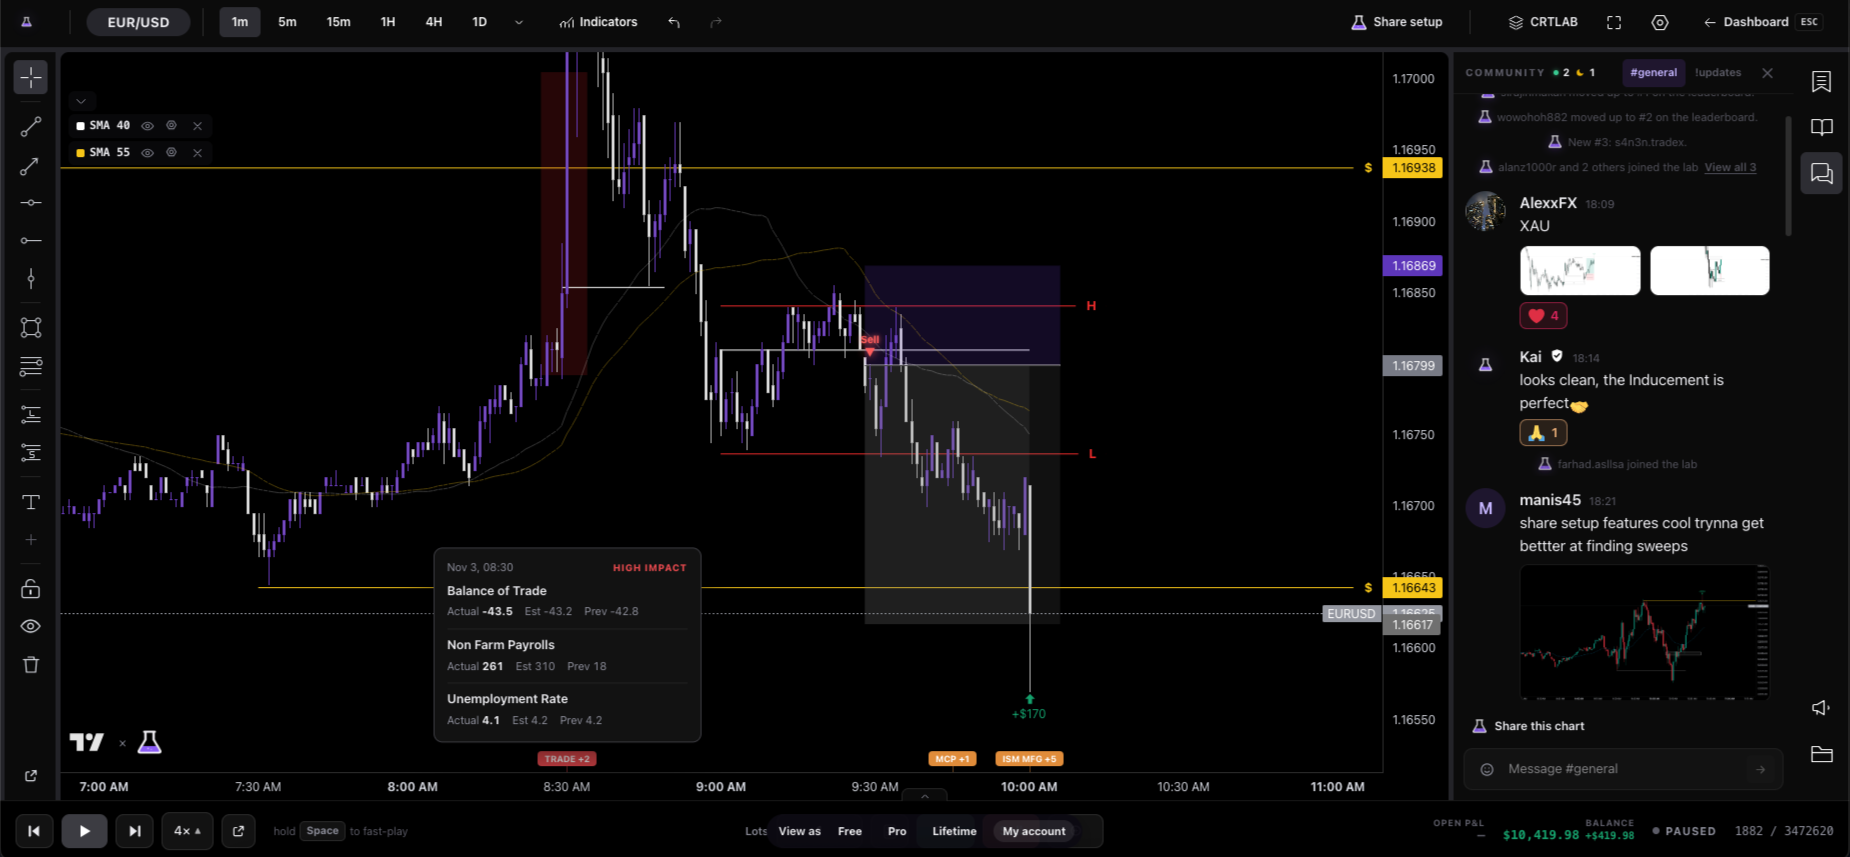
SMA or EMA? 50/200, 20/50, or 9/21? Signal on the cross, or on the first pullback after it? Each is a separate test and each produces a different number, and "the moving average crossover" as a single thing does not exist. CRTLAB draws simple, exponential and weighted averages at any period you like, so switching between them is a legend edit rather than a new setup.
Watch the flat-market cost specifically. Crossovers cluster: in a range, the two lines braid together and produce five signals in a week, all losers. Any backtest that reports an average without reporting that cluster has hidden the only thing that would have stopped you trading it.
Sizing it honestly
A crossover system's stop is usually far away — the other side of the slow average, or a recent swing. That means position size, not win rate, decides whether the equity curve is survivable. Run every logged trade through the position size calculator at the risk you'd genuinely take, and check the result against the risk of ruin calculator.
Frequently asked questions
Which moving averages does the chart open with?
A 50 and a 200 exponential moving average, in two distinct colours so the cross is visible. Both periods are editable from the legend, and you can switch either to simple or weighted.
Can I backtest a golden cross on a daily chart?
Yes — every timeframe up to weekly is available, and the crossover is drawn identically on all of them. On the free tier the daily chart's two-week window is short, so a serious daily-timeframe study is where the full history matters.
SMA or EMA for crossovers?
Test both. The EMA reacts faster, so it crosses earlier and whipsaws more; the SMA is smoother and later. Which trade-off pays depends on the instrument, and you can settle it in an afternoon rather than argue about it.
Is it free?
Yes — all built-in indicators are free on all 21 free markets, on the most recent two weeks of data, with no account required.
Open SP500 with the 50/200 crossover plotted
One click — hourly S&P 500, both EMAs on the chart, replaying candle by candle.
Open the chart →