

Concept · Opening gaps
Opening Gap Backtester (NWOG / NDOG)
The gap between Friday's close and Sunday's open, and between yesterday's close and today's open. Two of the cleanest, most objective levels on any chart — they exist or they don't, there is nothing to interpret — and consequently two of the easiest things in trading to actually measure.
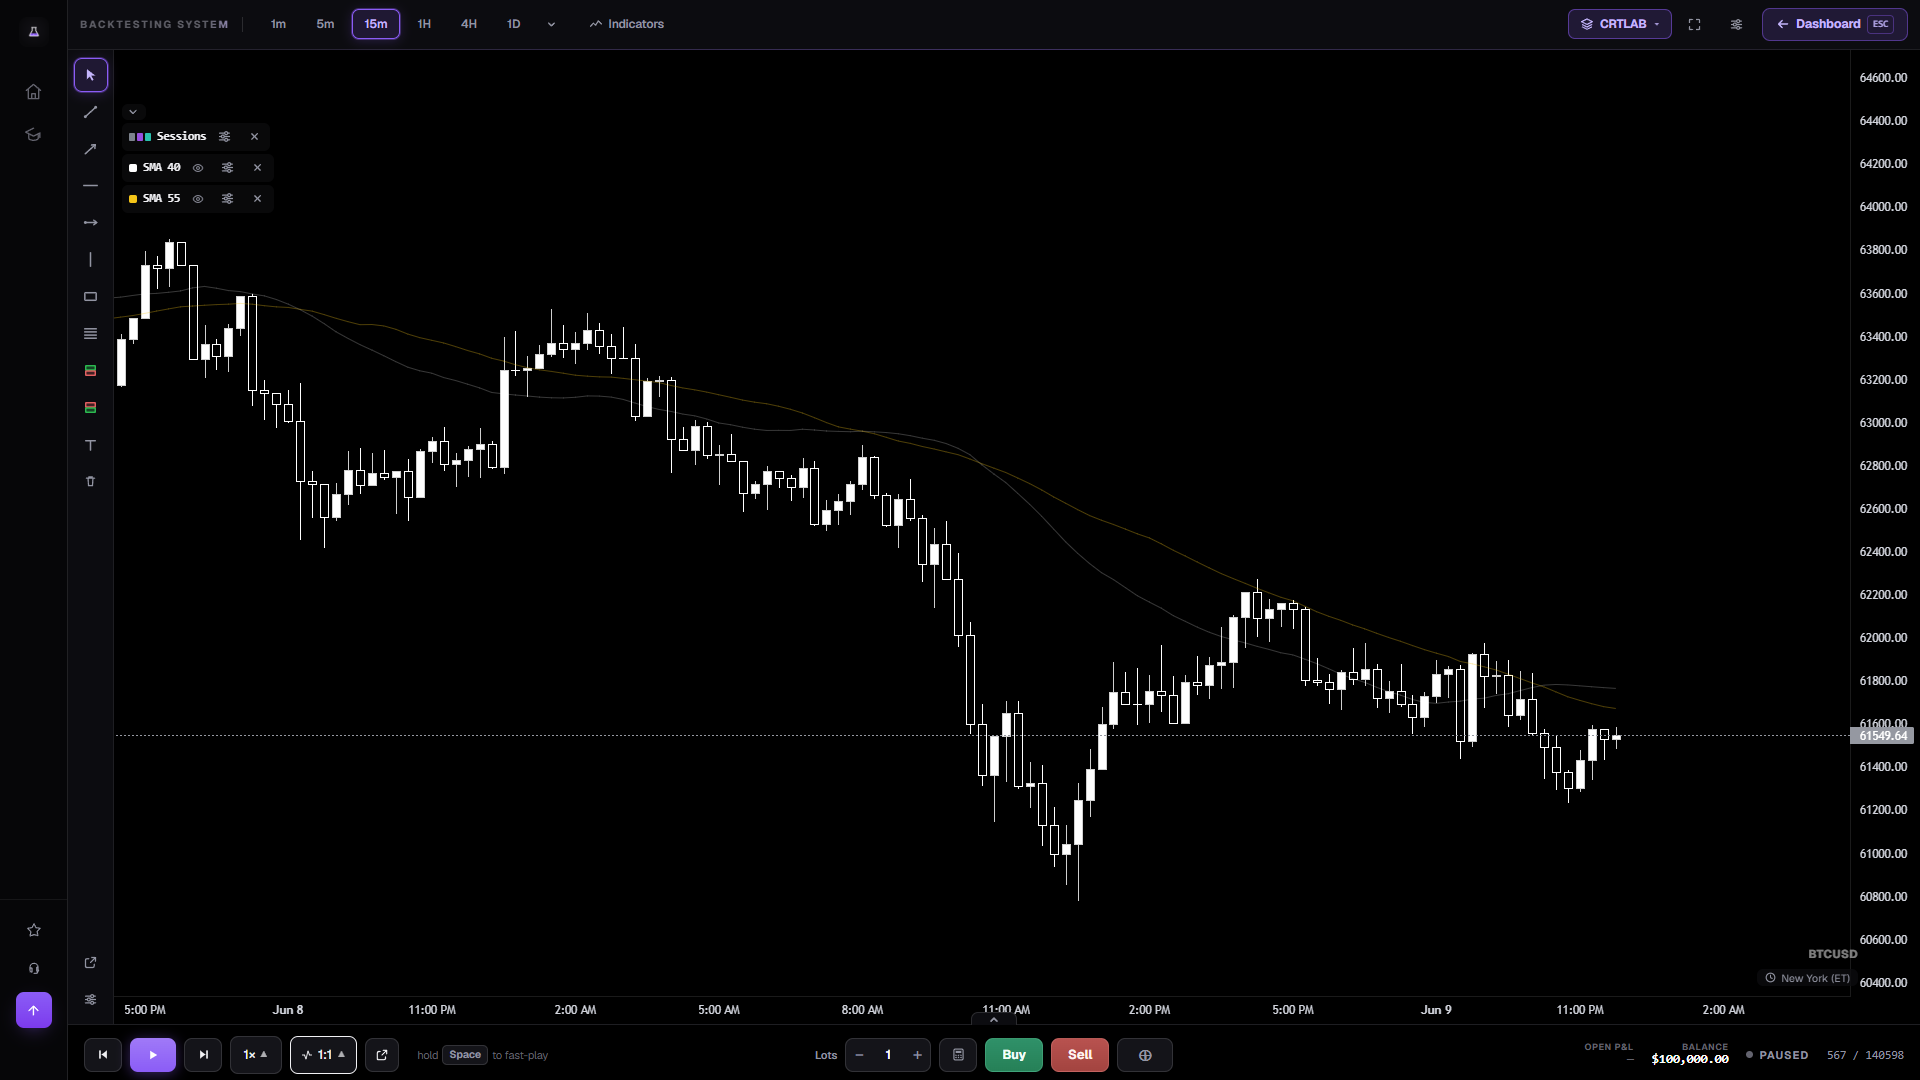
NWOG and NDOG, precisely
A new week opening gap is the range between Friday's closing price and Sunday's (or Monday's) opening price — the price band the market skipped over the weekend. A new day opening gap is the same thing across a single session boundary.
There is no ambiguity in either definition, which is unusual and valuable: two traders running this test on the same data will get the same gaps. Whatever they then disagree about is a disagreement about the strategy, not about the chart.
What the numbers usually show
Fill rate is the headline, and it is instrument-dependent to a degree that surprises people. Markets that trade continuously through the weekend fill differently from those with a genuine gap; gold and the indices behave nothing like each other here. Rather than take anyone's figure, run the same 100-gap test on gold and on NAS100 and compare.
The second number worth having is time to fill. A gap that fills 80% of the time but takes four days to do it is not the same trade as one that fills 65% of the time by Tuesday lunchtime, and a fill-rate-only backtest cannot tell them apart.
Frequently asked questions
Does it draw both weekly and daily opening gaps?
Yes — the same detector handles the week boundary and the day boundary, so you can run both at once and see which one price actually respects on your market.
How far back can I test gaps for free?
The free tier covers the most recent two weeks on every market, which is a handful of gaps — enough to see the tool work. A meaningful gap study needs years, which is what Pro's full history is for.
Which markets have the biggest opening gaps?
Instruments with a genuine trading halt gap hardest — index futures over the weekend, and equities overnight. Crypto trades continuously and gaps least, which itself is a useful control in the test.
Open gold with opening gaps drawn
One click — hourly XAUUSD, every week and day opening gap marked as a zone.
Open the chart →