

Indicator · Parabolic SAR
Parabolic SAR Backtester
Parabolic SAR is a trailing stop that accelerates: the longer a trend runs, the tighter it gets. That makes it excellent at riding a trend and notoriously terrible in a range — and the ratio between those two is entirely a property of your instrument and timeframe, which means it's a measurement, not an opinion.
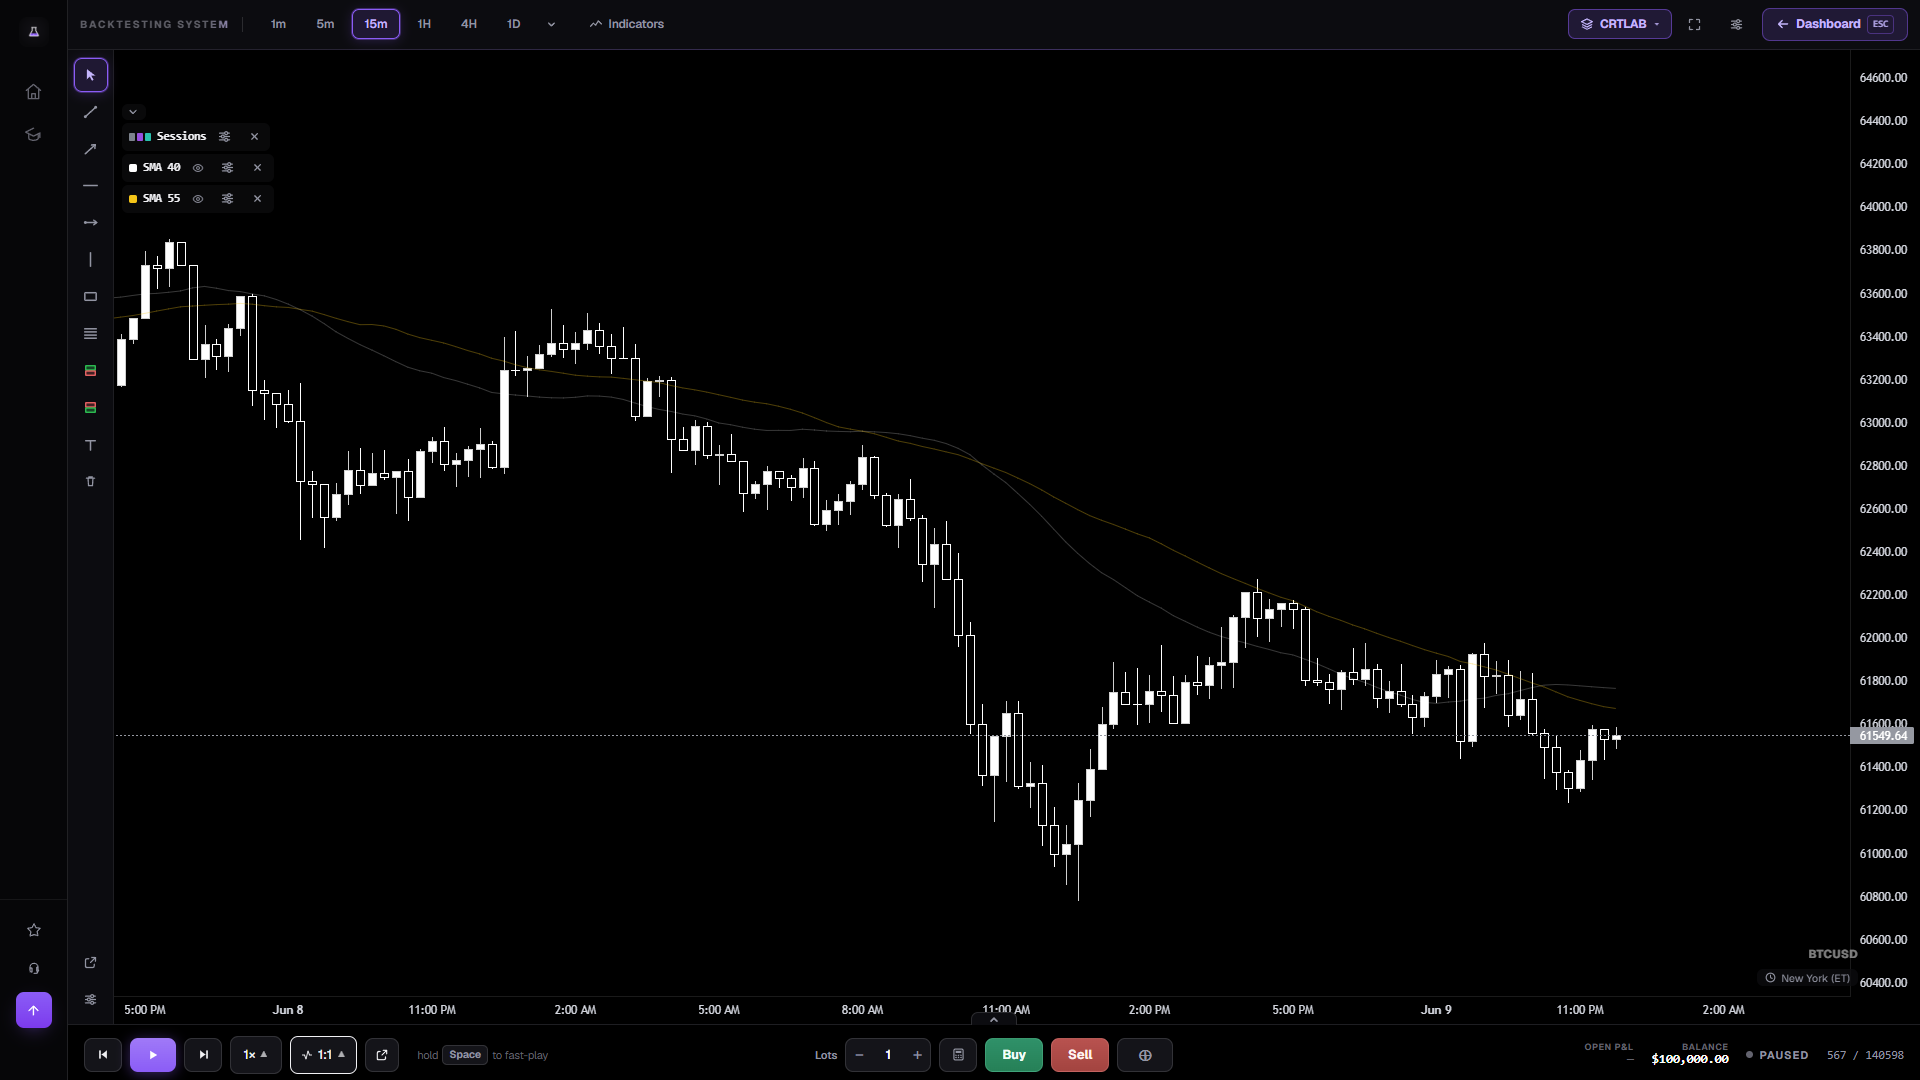
The acceleration factor is the whole indicator
SAR starts a step behind price and closes the gap a little each candle the trend continues, accelerating until it's clipped tight against price. A higher step means a tighter, twitchier stop that exits early; a lower one gives the trend more room and gives back more at the turn. CRTLAB exposes the step so the trade-off is testable rather than inherited from a default.
Test it as an exit, not an entry
SAR's flips make poor entries — by the time it flips, a chunk of the move is gone. Its real use is as a trailing stop on a position you entered some other way, and that is the test worth running: take your existing entry rules, exit every trade on the SAR flip, and compare the result against your current exit.
Log both exits on the same trades. That paired comparison controls for the entries entirely, which makes it a far cleaner experiment than running two separate strategies and comparing the totals.
Frequently asked questions
Can I change the step and maximum?
The acceleration step is editable from the chart legend, so tightening or loosening the trail is a setting change and an immediate redraw across the whole replay.
Why does SAR whipsaw so much?
Because it never stops tightening while the trend continues, so a sideways market with no trend to follow flips it constantly. That's not a flaw to fix — it's the property you're measuring the cost of.
Is it free?
Yes, like every built-in indicator, on all 21 free markets.
Open GBPUSD with Parabolic SAR on
One click — hourly cable, SAR plotted, flipping as each candle closes.
Open the chart →