

Indicator · Keltner Channels
Keltner Channel Backtester
Keltner Channels are the quieter sibling of the Bollinger Band, and the difference between them is not cosmetic: Keltner scales its bands by average true range, Bollinger by standard deviation. That one substitution changes when the bands widen, which changes every signal built on them.
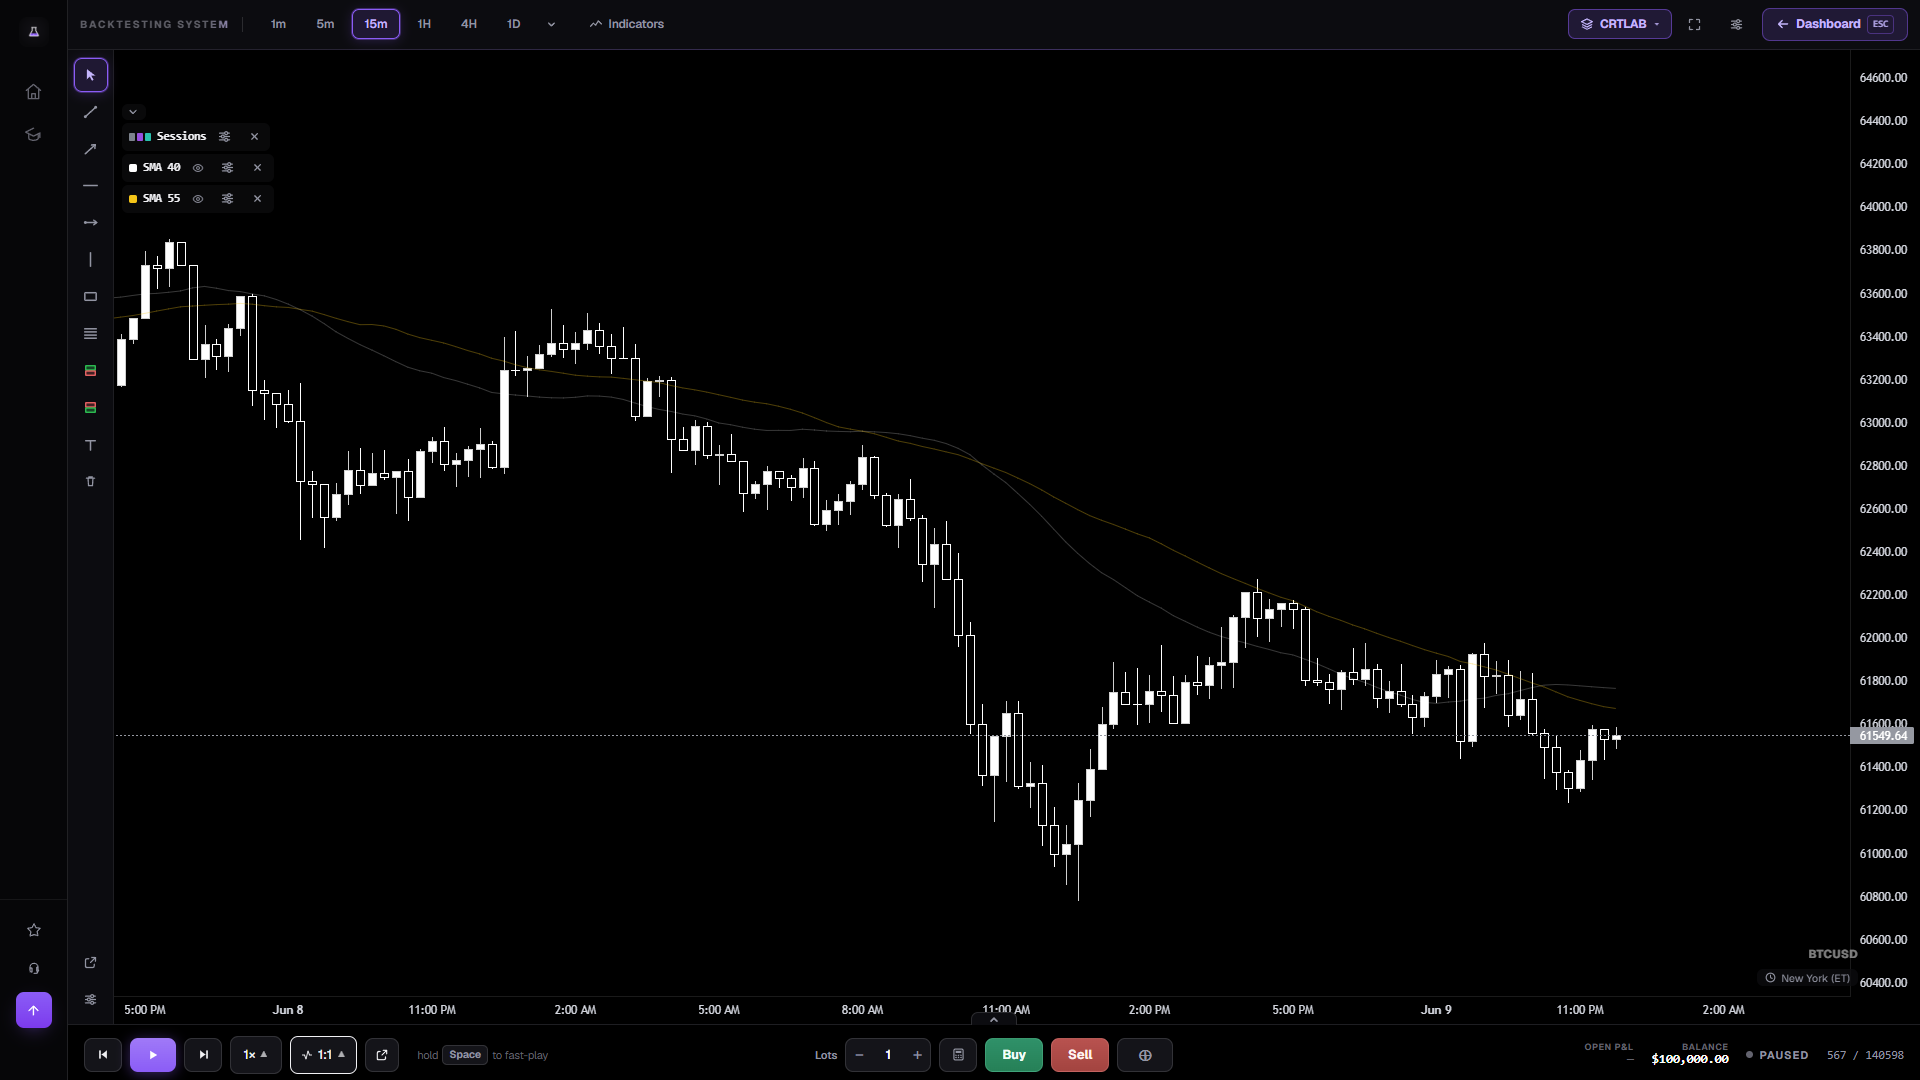
ATR versus standard deviation, and why it matters
Standard deviation reacts to how far closes have scattered. Average true range reacts to how far each candle actually travelled, gaps included. On a market that gaps or wicks hard — index futures at the open, gold on a data release — those two numbers diverge sharply, and the bands sit in visibly different places.
The practical consequence: Keltner tends to be smoother and less prone to the sudden flare a single outlier candle causes in a Bollinger band. Whether smoother is better is, again, a testable question rather than a philosophical one.
The comparison worth running
Plot both on the same chart and run one log with two columns: did the Bollinger band signal, did the Keltner channel signal, and what happened. A few hundred candles of that will tell you more about your instrument's volatility character than any amount of reading — and the squeeze condition traders look for (Bollinger bands contracting inside the Keltner channel) is only observable when both are up at once.
Frequently asked questions
Can I plot Keltner and Bollinger together?
Yes — add both from the indicator list and they draw in separate colours, which is the only way to see the classic squeeze condition where one contracts inside the other.
What multiplier does it default to?
A 20-period basis with a 2× ATR multiplier, both editable from the legend.
Is it free?
Yes. Every built-in indicator is free on every market — the paid line is CRTLAB's own overlays, not the standard studies.
Open NAS100 with Keltner Channels on
One click — 15-minute Nasdaq, ATR channels plotted, replaying candle by candle.
Open the chart →