

Timeframe · 1 minute
1-Minute Chart Backtesting
The minute chart is where scalpers live and where backtests go to be flattering. It produces setups faster than any other timeframe — which means a sample arrives in an evening, and it also means every flaw in your process compounds four hundred times before you notice it.
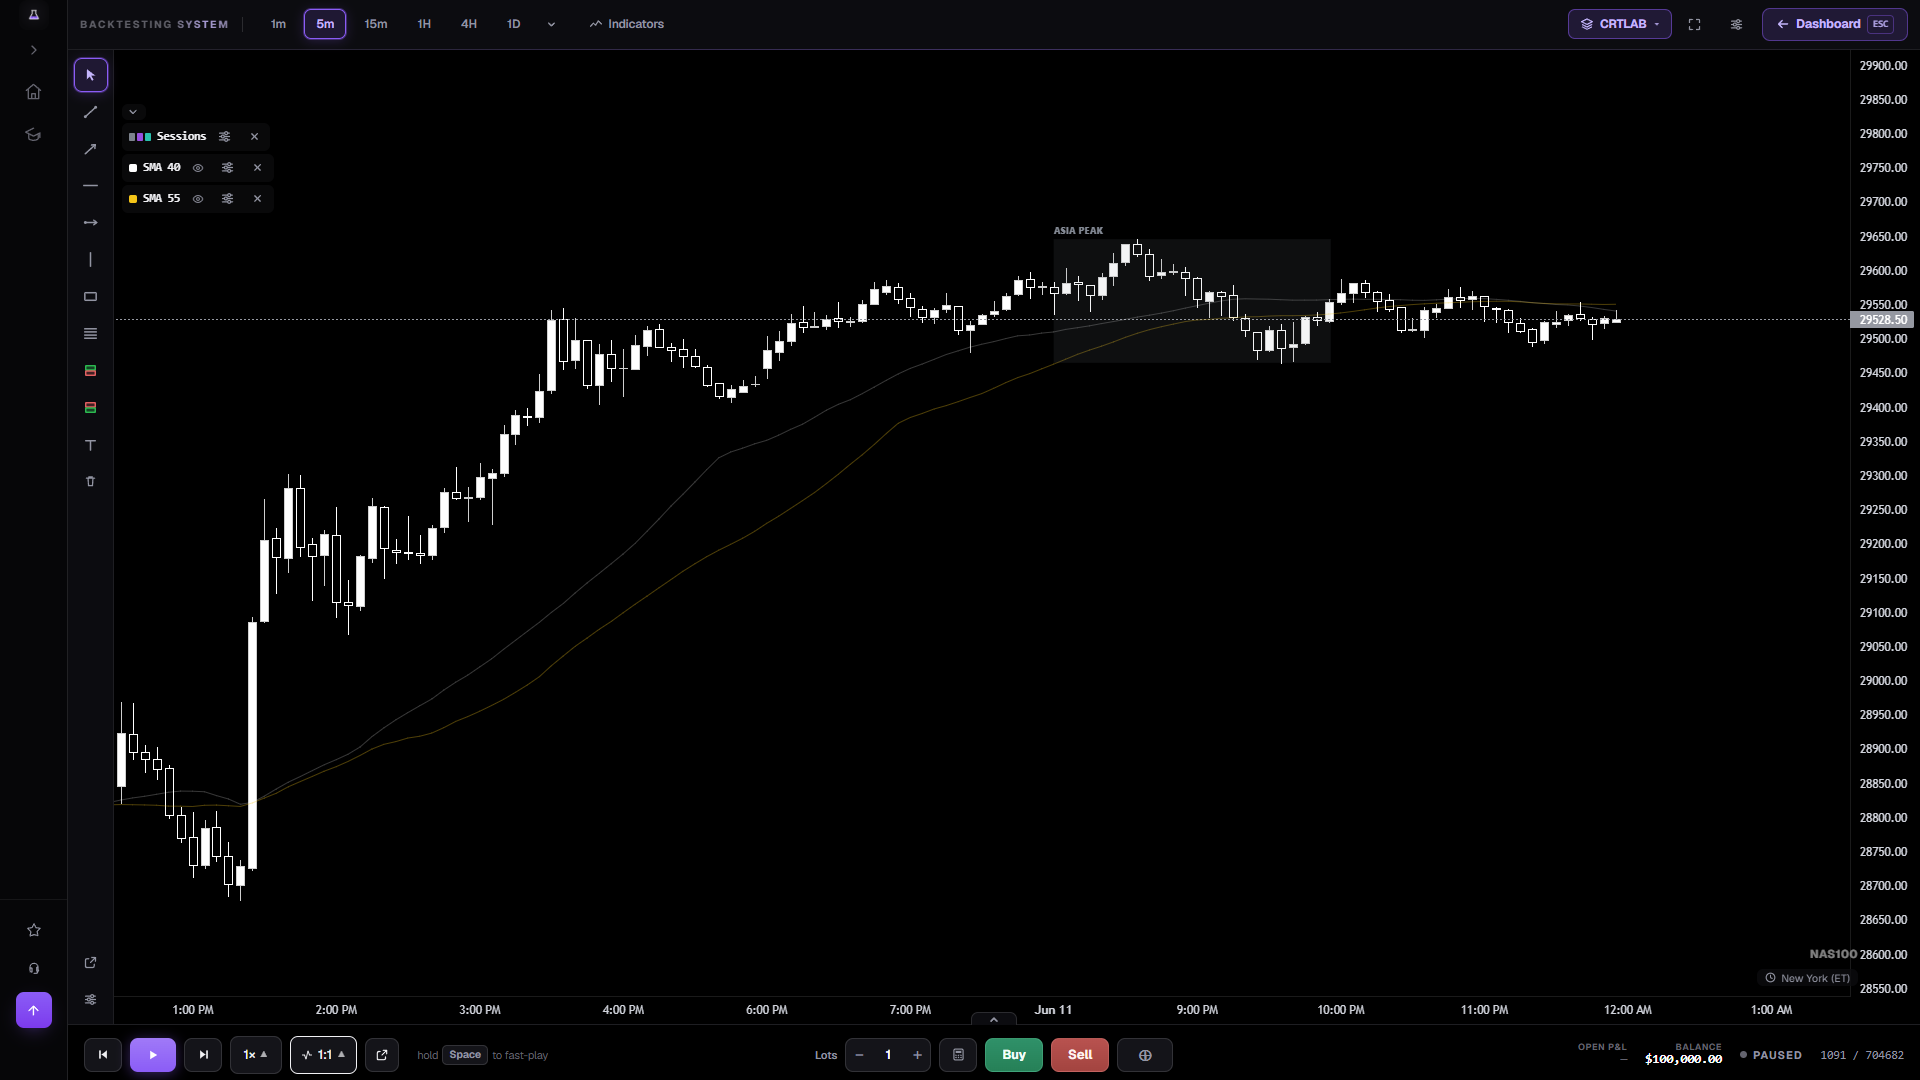
The honest case for the minute chart
Sample size. A setup that appears twice a week on the hourly appears several times a day on the minute chart, so a hundred occurrences is an evening's work rather than a year's. If what you are testing is a mechanical pattern — an imbalance, a sweep, a break — the minute chart is the cheapest place on earth to count it.
Reaction time is the second case. Replay on a minute chart with the future hidden is the closest thing to the pressure of a live scalp that does not cost money, and it is the only way to find out whether you can actually execute a rule at that speed or only admire it afterwards.
What the minute chart will genuinely look like
Quiet. CRTLAB's candles are built from real data rather than smoothed, so a run of near-flat 1-minute bars on a major FX pair at 22:00 New York time is exactly what the market did — not a gap in the feed. That is worth knowing before you conclude the data is broken: thin hours produce thin candles on every honest feed, and the ones that don't are inventing movement.
Costs also stop being a rounding error. On the hourly a spread is a fraction of a typical move; on the minute chart it can be a meaningful share of the whole trade. A minute-chart backtest that ignores spread and slippage is not optimistic, it is measuring a different instrument. Work each logged trade through the pip calculator at your real spread before you believe the R.
How to run it without fooling yourself
Fix the rule before the first candle and take every occurrence, including the ones that look wrong at the time. Skipping the ugly ones is the single most effective way to turn a coin-flip into a 70% win rate on paper, and it is far easier to do on a minute chart because there are so many more of them to skip.
Then check the sample is big enough to mean anything — the sample size calculator turns your assumed edge into a required number of trades — and check that the win rate you found survives its own losing streaks with the risk of ruin calculator.
Every timeframe from 1 minute to monthly is free in CRTLAB, and none of them are gated. The timeframe is the axis you read a chart on, not a feature.
Frequently asked questions
Can I backtest on a 1-minute chart for free?
Yes. Every timeframe from 1 minute to monthly is free on every market — the free tier limits how far back you can go, not which timeframes you can use.
Why do some 1-minute candles have almost no range?
Because the market was quiet. The feed is real, so thin hours look thin — a flat run on a major FX pair during Asian hours is the market, not a data fault. Any feed where the minute chart always looks busy is smoothing something.
Is the 1-minute chart good for backtesting?
For mechanical patterns, yes — it produces a usable sample in a single evening. For anything discretionary it is unforgiving, because there are so many more marginal setups to talk yourself into. Both of those are reasons to test on it rather than reasons to avoid it.
Does every market have 1-minute data?
Nearly all of them. A small number of instruments have no genuine sub-15-minute history, and the chart clamps to the finest timeframe that instrument actually has rather than inventing candles for it.
Open a 1-minute chart, one candle at a time
One click — NAS100 on the minute, fair value gaps and key levels already drawn.
Open the chart →